M2 pyruvate kinase provides a mechanism for nutrient sensing and regulation of cell proliferation
- PMID: 23530218
- PMCID: PMC3625322
- DOI: 10.1073/pnas.1217157110
M2 pyruvate kinase provides a mechanism for nutrient sensing and regulation of cell proliferation
Abstract
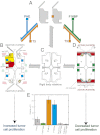
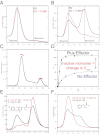
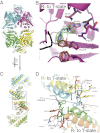
We show that the M2 isoform of pyruvate kinase (M2PYK) exists in equilibrium between monomers and tetramers regulated by allosteric binding of naturally occurring small-molecule metabolites. Phenylalanine stabilizes an inactive T-state tetrameric conformer and inhibits M2PYK with an IC50 value of 0.24 mM, whereas thyroid hormone (triiodo-L-thyronine, T3) stabilizes an inactive monomeric form of M2PYK with an IC50 of 78 nM. The allosteric activator fructose-1,6-bisphosphate [F16BP, AC50 (concentration that gives 50% activation) of 7 μM] shifts the equilibrium to the tetrameric active R-state, which has a similar activity to that of the constitutively fully active isoform M1PYK. Proliferation assays using HCT-116 cells showed that addition of inhibitors phenylalanine and T3 both increased cell proliferation, whereas addition of the activator F16BP reduced proliferation. F16BP abrogates the inhibitory effect of both phenylalanine and T3, highlighting a dominant role of M2PYK allosteric activation in the regulation of cancer proliferation. X-ray structures show constitutively fully active M1PYK and F16BP-bound M2PYK in an R-state conformation with a lysine at the dimer-interface acting as a peg in a hole, locking the active tetramer conformation. Binding of phenylalanine in an allosteric pocket induces a 13° rotation of the protomers, destroying the peg-in-hole R-state interface. This distinct T-state tetramer is stabilized by flipped out Trp/Arg side chains that stack across the dimer interface. X-ray structures and biophysical binding data of M2PYK complexes explain how, at a molecular level, fluctuations in concentrations of amino acids, thyroid hormone, and glucose metabolites switch M2PYK on and off to provide the cell with a nutrient sensing and growth signaling mechanism.
Conflict of interest statement
The authors declare no conflict of interest.
Figures


Similar articles
-
An allostatic mechanism for M2 pyruvate kinase as an amino-acid sensor.Biochem J. 2018 May 31;475(10):1821-1837. doi: 10.1042/BCJ20180171. Biochem J. 2018. PMID: 29748232 Free PMC article.
-
Redox regulation of pyruvate kinase M2 by cysteine oxidation and S-nitrosation.Biochem J. 2018 Oct 31;475(20):3275-3291. doi: 10.1042/BCJ20180556. Biochem J. 2018. PMID: 30254098 Free PMC article.
-
An in vitro novel mechanism of regulating the activity of pyruvate kinase M2 by thyroid hormone and fructose 1, 6-bisphosphate.Biochemistry. 1991 Jul 23;30(29):7105-11. doi: 10.1021/bi00243a010. Biochemistry. 1991. PMID: 1854723
-
A critical review of the role of M2PYK in the Warburg effect.Biochim Biophys Acta Rev Cancer. 2019 Apr;1871(2):225-239. doi: 10.1016/j.bbcan.2019.01.004. Epub 2019 Jan 29. Biochim Biophys Acta Rev Cancer. 2019. PMID: 30708038 Free PMC article. Review.
-
The allosteric regulation of pyruvate kinase.FEBS Lett. 1996 Jun 24;389(1):15-9. doi: 10.1016/0014-5793(96)00462-0. FEBS Lett. 1996. PMID: 8682196 Review.
Cited by
-
Covalent Inhibition of Pyruvate Kinase M2 Reprograms Metabolic and Inflammatory Pathways in Hepatic Macrophages against Non-alcoholic Fatty Liver Disease.Int J Biol Sci. 2022 Aug 15;18(14):5260-5275. doi: 10.7150/ijbs.73890. eCollection 2022. Int J Biol Sci. 2022. PMID: 36147457 Free PMC article.
-
The molecular mechanisms of LncRNA-correlated PKM2 in cancer metabolism.Biosci Rep. 2019 Nov 29;39(11):BSR20192453. doi: 10.1042/BSR20192453. Biosci Rep. 2019. PMID: 31654067 Free PMC article. Review.
-
Mutations in the PKM2 exon-10 region are associated with reduced allostery and increased nuclear translocation.Commun Biol. 2019 Mar 15;2:105. doi: 10.1038/s42003-019-0343-4. eCollection 2019. Commun Biol. 2019. PMID: 30911680 Free PMC article.
-
Bistability in glycolysis pathway as a physiological switch in energy metabolism.PLoS One. 2014 Jun 9;9(6):e98756. doi: 10.1371/journal.pone.0098756. eCollection 2014. PLoS One. 2014. PMID: 24911170 Free PMC article.
-
Targeting Pyruvate Kinase M2 Phosphorylation Reverses Aggressive Cancer Phenotypes.Cancer Res. 2021 Aug 15;81(16):4346-4359. doi: 10.1158/0008-5472.CAN-20-4190. Epub 2021 Jun 21. Cancer Res. 2021. PMID: 34185676 Free PMC article.
References
-
- Dombrauckas JD, Santarsiero BD, Mesecar AD. Structural basis for tumor pyruvate kinase M2 allosteric regulation and catalysis. Biochemistry. 2005;44(27):9417–9429. - PubMed
-
- Christofk HR, et al. The M2 splice isoform of pyruvate kinase is important for cancer metabolism and tumour growth. Nature. 2008;452(7184):230–233. - PubMed
Publication types
MeSH terms
Substances
Associated data
- Actions
- Actions
- Actions
Grants and funding
LinkOut - more resources
Full Text Sources
Other Literature Sources
Molecular Biology Databases

