

mTOR regulates lysosomal ATP-sensitive two-pore Na(+) channels to adapt to metabolic state
- PMID: 23394946
- PMCID: PMC3908667
- DOI: 10.1016/j.cell.2013.01.023
mTOR regulates lysosomal ATP-sensitive two-pore Na(+) channels to adapt to metabolic state
Abstract
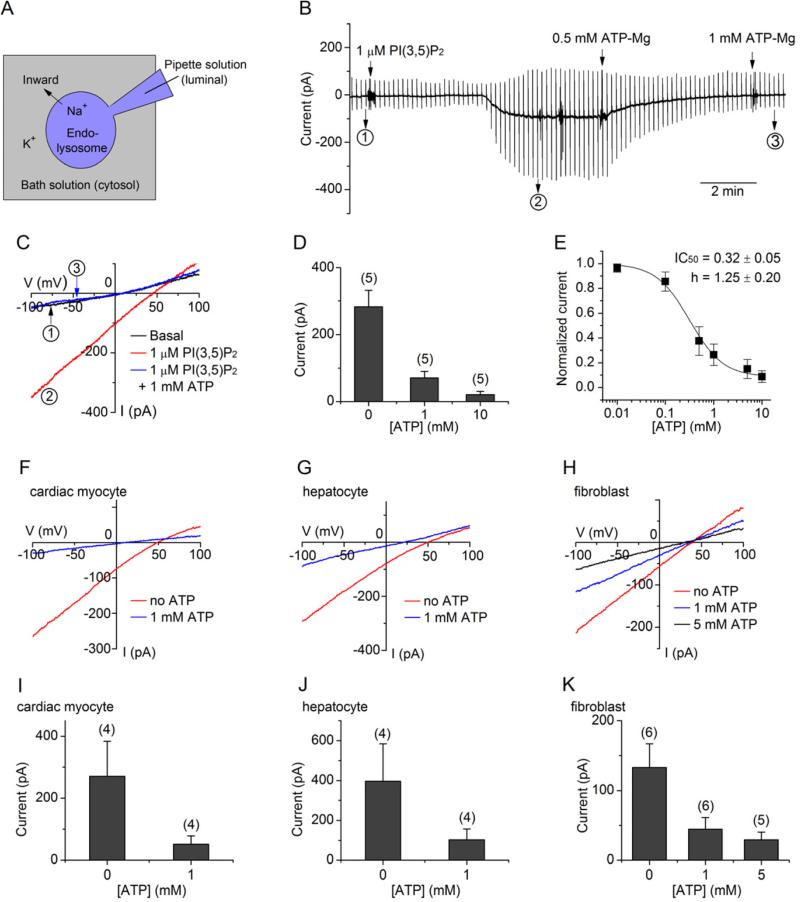
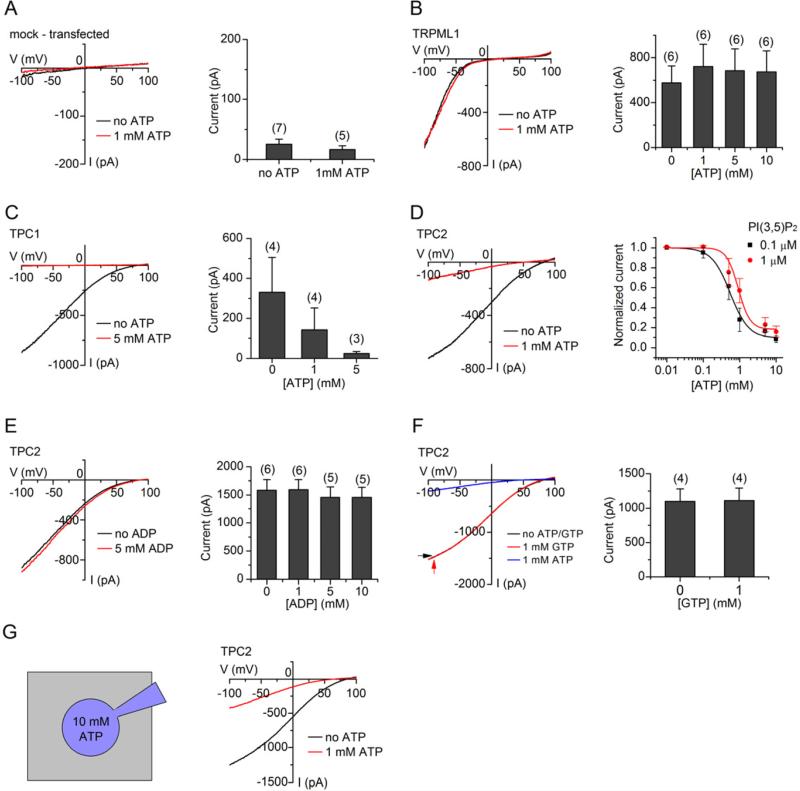
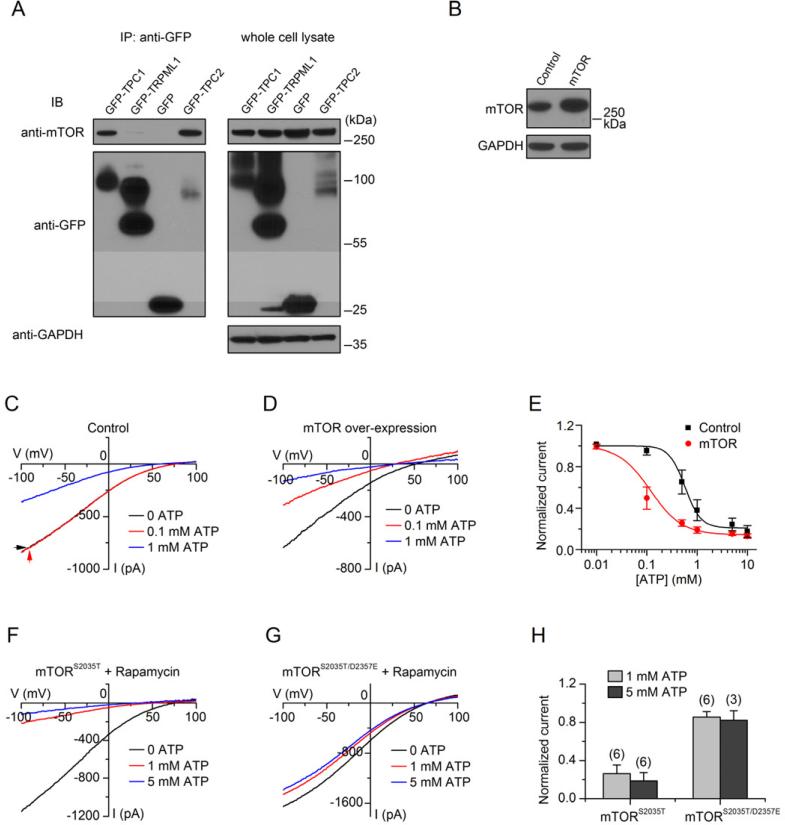
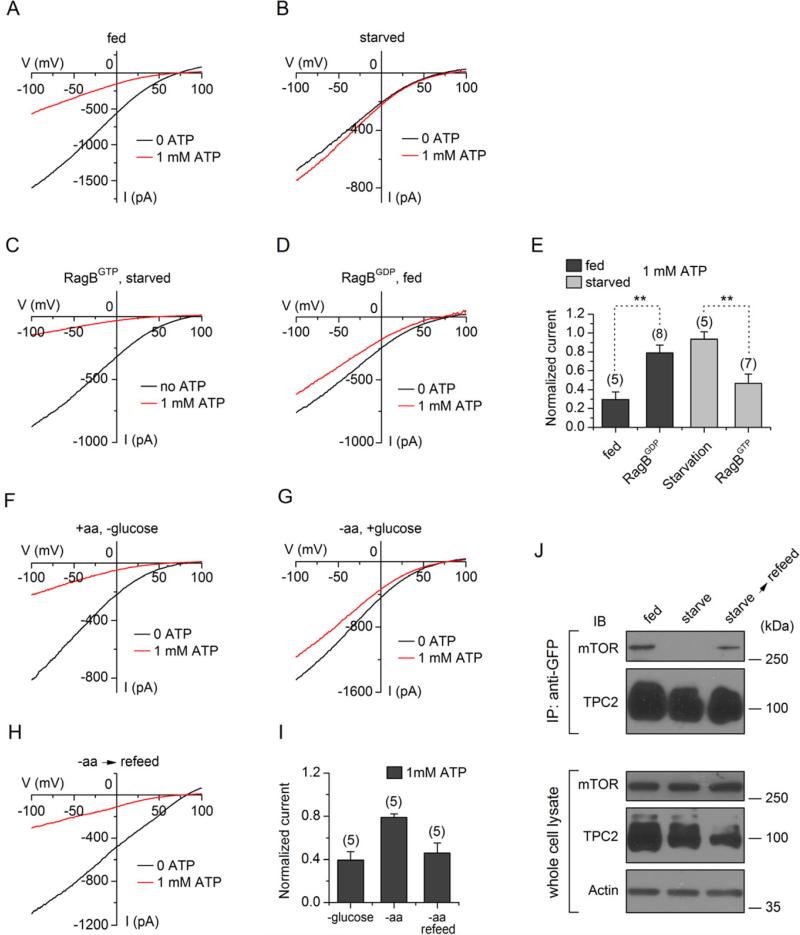
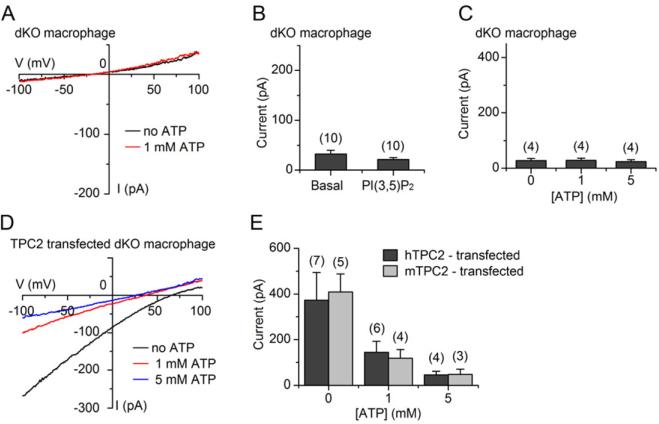
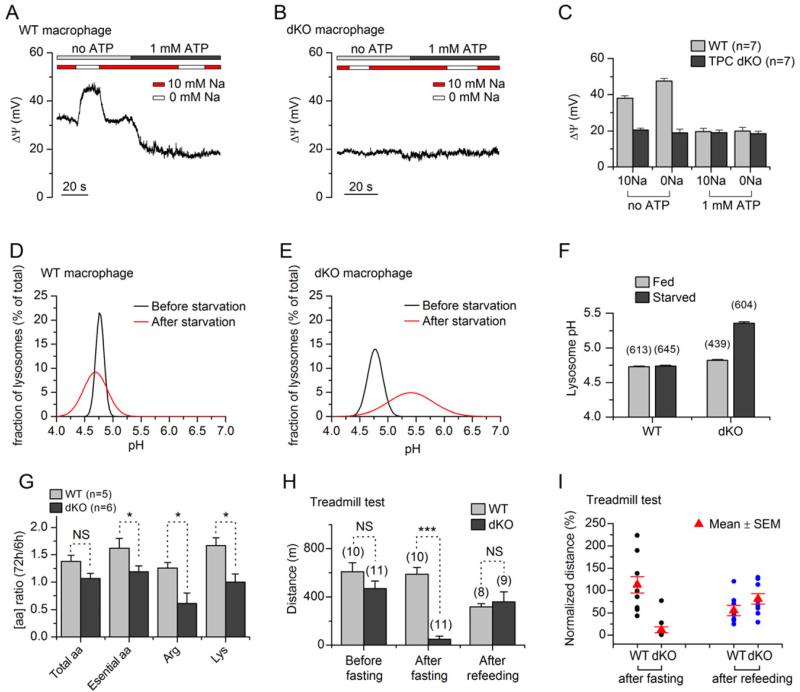
Survival in the wild requires organismal adaptations to the availability of nutrients. Endosomes and lysosomes are key intracellular organelles that couple nutrition and metabolic status to cellular responses, but how they detect cytosolic ATP levels is not well understood. Here, we identify an endolysosomal ATP-sensitive Na(+) channel (lysoNa(ATP)). The channel is a complex formed by two-pore channels (TPC1 and TPC2), ion channels previously thought to be gated by nicotinic acid adenine dinucleotide phosphate (NAADP), and the mammalian target of rapamycin (mTOR). The channel complex detects nutrient status, becomes constitutively open upon nutrient removal and mTOR translocation off the lysosomal membrane, and controls the lysosome's membrane potential, pH stability, and amino acid homeostasis. Mutant mice lacking lysoNa(ATP) have much reduced exercise endurance after fasting. Thus, TPCs make up an ion channel family that couples the cell's metabolic state to endolysosomal function and are crucial for physical endurance during food restriction.
Copyright © 2013 Elsevier Inc. All rights reserved.
Figures

Comment in
-
Cell signalling: Where the mTOR action is.Nat Rev Mol Cell Biol. 2013 Apr;14(4):191. doi: 10.1038/nrm3549. Epub 2013 Mar 6. Nat Rev Mol Cell Biol. 2013. PMID: 23463220 No abstract available.
-
Cell signalling: where the mTOR action is.Nat Rev Mol Cell Biol. 2013 Apr;14(4):191. Nat Rev Mol Cell Biol. 2013. PMID: 23847773 No abstract available.
Similar articles
-
TPC proteins are phosphoinositide- activated sodium-selective ion channels in endosomes and lysosomes.Cell. 2012 Oct 12;151(2):372-83. doi: 10.1016/j.cell.2012.08.036. Cell. 2012. PMID: 23063126 Free PMC article.
-
Two pore channel 2 (TPC2) inhibits autophagosomal-lysosomal fusion by alkalinizing lysosomal pH.J Biol Chem. 2013 Aug 16;288(33):24247-63. doi: 10.1074/jbc.M113.484253. Epub 2013 Jul 8. J Biol Chem. 2013. Retraction in: J Biol Chem. 2017 Jul 21;292(29):12088. doi: 10.1074/jbc.A113.484253. PMID: 23836916 Free PMC article. Retracted.
-
mTORC1 controls lysosomal Ca2+ release through the two-pore channel TPC2.Sci Signal. 2018 Apr 10;11(525):eaao5775. doi: 10.1126/scisignal.aao5775. Sci Signal. 2018. PMID: 29636391 Free PMC article.
-
Calcium signaling via two-pore channels: local or global, that is the question.Am J Physiol Cell Physiol. 2010 Mar;298(3):C430-41. doi: 10.1152/ajpcell.00475.2009. Epub 2009 Dec 16. Am J Physiol Cell Physiol. 2010. PMID: 20018950 Free PMC article. Review.
-
The endo-lysosomal system as an NAADP-sensitive acidic Ca(2+) store: role for the two-pore channels.Cell Calcium. 2011 Aug;50(2):157-67. doi: 10.1016/j.ceca.2011.03.011. Epub 2011 May 6. Cell Calcium. 2011. PMID: 21529939 Free PMC article. Review.
Cited by
-
Lysosomal Calcium Channels in Autophagy and Cancer.Cancers (Basel). 2021 Mar 15;13(6):1299. doi: 10.3390/cancers13061299. Cancers (Basel). 2021. PMID: 33803964 Free PMC article. Review.
-
Chemical and biochemical control of skin pigmentation with special emphasis on mixed melanogenesis.Pigment Cell Melanoma Res. 2021 Jul;34(4):730-747. doi: 10.1111/pcmr.12970. Epub 2021 Mar 22. Pigment Cell Melanoma Res. 2021. PMID: 33751833 Free PMC article. Review.
-
Imaging the electrical activity of organelles in living cells.Commun Biol. 2021 Mar 23;4(1):389. doi: 10.1038/s42003-021-01916-6. Commun Biol. 2021. PMID: 33758369 Free PMC article.
-
Two-Pore Channels Regulate Inter-Organellar Ca2+ Homeostasis in Immune Cells.Cells. 2022 Apr 26;11(9):1465. doi: 10.3390/cells11091465. Cells. 2022. PMID: 35563771 Free PMC article. Review.
-
Reconstituted human TPC1 is a proton-permeable ion channel and is activated by NAADP or Ca2+.Sci Signal. 2014 May 20;7(326):ra46. doi: 10.1126/scisignal.2004854. Sci Signal. 2014. PMID: 24847115 Free PMC article.
References
-
- Baukrowitz T, Schulte U, Oliver D, Herlitze S, Krauter T, Tucker SJ, Ruppersberg JP, Fakler B. PIP2 and PIP as determinants for ATP inhibition of KATP channels. Science. 1998;282:1141–1144. - PubMed
-
- Bertl A, Blumwald E, Coronado R, Eisenberg R, Findlay G, Gradmann D, Hille B, Kohler K, Kolb H-A, MacRobbie E, et al. Electrical measurements on endomembranes. Science. 1992;258:873–874. - PubMed
-
- Brady JJ, Romsos DR, Brady PS, Bergen WG, Leveille GA. The effects of fasting on body composition, glucose turnover, enzymes and metabolites in the chicken. J Nutr. 1978;108:648–657. - PubMed
Publication types
MeSH terms
Substances
Grants and funding
LinkOut - more resources
Full Text Sources
Other Literature Sources
Molecular Biology Databases
Research Materials
Miscellaneous
