Viral latency locus augments B-cell response in vivo to induce chronic marginal zone enlargement, plasma cell hyperplasia, and lymphoma
- PMID: 23365457
- PMCID: PMC3624941
- DOI: 10.1182/blood-2012-03-415620
Viral latency locus augments B-cell response in vivo to induce chronic marginal zone enlargement, plasma cell hyperplasia, and lymphoma
Abstract
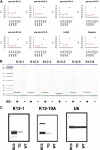
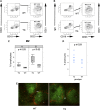
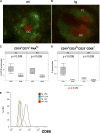
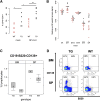
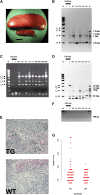
Kaposi sarcoma (KS) is associated with KS-associated herpesvirus (KSHV). This virus also causes B-cell lymphoma and B-cell hyperplasia. There exists no in vivo model for KSHV-associated B-cell malignancies or premalignant persistence in B cells. We generated a transgenic mouse that expresses multiple viral latent genes, including LANA, vFLIP, vCYC, all viral micro RNAs, and kaposin under the transcriptional control of their natural regulatory region. This promoter is B-cell specific, though it is a weak promoter. Mature B cells were chronically activated, leading to hyperglobulinemia triggered by increased plasma cell frequency and marginal zone (MZ) B-cell hyperplasia. The mice had an augmented response to T-dependent antigen as well as the TLR4 ligand LPS, leading to exacerbated MZ and germinal center responses and increased CD138(+) plasma cells. It is the first model to assess the viral micro RNA function in vivo. These data support a potentially novel mechanism of viral persistence in which virally infected B cells become hyper-responsive to coincident, but unrelated, pathogen exposure, leading to preferential expansion and ultimately lymphoma in a small subset of cases.
Figures


Similar articles
-
KSHV Latency Locus Cooperates with Myc to Drive Lymphoma in Mice.PLoS Pathog. 2015 Sep 1;11(9):e1005135. doi: 10.1371/journal.ppat.1005135. eCollection 2015 Sep. PLoS Pathog. 2015. PMID: 26327622 Free PMC article.
-
The viral latency-associated nuclear antigen augments the B-cell response to antigen in vivo.J Virol. 2010 Oct;84(20):10653-60. doi: 10.1128/JVI.00848-10. Epub 2010 Aug 4. J Virol. 2010. PMID: 20686032 Free PMC article.
-
Tissue specificity of the Kaposi's sarcoma-associated herpesvirus latent nuclear antigen (LANA/orf73) promoter in transgenic mice.J Virol. 2002 Nov;76(21):11024-32. doi: 10.1128/jvi.76.21.11024-11032.2002. J Virol. 2002. PMID: 12368345 Free PMC article.
-
KSHV Genome Replication and Maintenance in Latency.Adv Exp Med Biol. 2018;1045:299-320. doi: 10.1007/978-981-10-7230-7_14. Adv Exp Med Biol. 2018. PMID: 29896673 Review.
-
[Epstein-Barr virus (EBV) and Kaposi's sarcoma-associated herpesvirus (KSHV, HHV-8)].Uirusu. 2010 Dec;60(2):237-45. doi: 10.2222/jsv.60.237. Uirusu. 2010. PMID: 21488336 Review. Japanese.
Cited by
-
Human herpesvirus-encoded kinase induces B cell lymphomas in vivo.J Clin Invest. 2018 Jun 1;128(6):2519-2534. doi: 10.1172/JCI97053. Epub 2018 May 7. J Clin Invest. 2018. PMID: 29733294 Free PMC article.
-
Interleukin 1 receptor-associated kinase 1 (IRAK1) mutation is a common, essential driver for Kaposi sarcoma herpesvirus lymphoma.Proc Natl Acad Sci U S A. 2014 Nov 4;111(44):E4762-8. doi: 10.1073/pnas.1405423111. Epub 2014 Oct 23. Proc Natl Acad Sci U S A. 2014. PMID: 25341731 Free PMC article.
-
The Role of Lytic Infection for Lymphomagenesis of Human γ-Herpesviruses.Front Cell Infect Microbiol. 2021 Mar 26;11:605258. doi: 10.3389/fcimb.2021.605258. eCollection 2021. Front Cell Infect Microbiol. 2021. PMID: 33842383 Free PMC article. Review.
-
Systemically circulating viral and tumor-derived microRNAs in KSHV-associated malignancies.PLoS Pathog. 2013;9(7):e1003484. doi: 10.1371/journal.ppat.1003484. Epub 2013 Jul 18. PLoS Pathog. 2013. PMID: 23874201 Free PMC article. Clinical Trial.
-
Kaposi sarcoma.Nat Rev Dis Primers. 2019 Jan 31;5(1):9. doi: 10.1038/s41572-019-0060-9. Nat Rev Dis Primers. 2019. PMID: 30705286 Free PMC article. Review.
References
-
- Cesarman E, Chang Y, Moore PS, et al. Kaposi’s sarcoma-associated herpesvirus-like DNA sequences in AIDS-related body-cavity-based lymphomas. N Engl J Med. 1995;332(18):1186–1191. - PubMed
-
- Soulier J, Grollet L, Oksenhendler E, et al. Kaposi’s sarcoma-associated herpesvirus-like DNA sequences in multicentric Castleman’s disease. Blood. 1995;86(4):1276–1280. - PubMed
-
- Ambroziak JA, Blackbourn DJ, Herndier BG, et al. Herpes-like sequences in HIV-infected and uninfected Kaposi’s sarcoma patients. Science. 1995;268(5210):582–583. - PubMed
Publication types
MeSH terms
Substances
Grants and funding
LinkOut - more resources
Full Text Sources
Other Literature Sources
Medical
Molecular Biology Databases

