. 2013 Mar 1;41(5):2993-3009.
doi: 10.1093/nar/gkt033. Epub 2013 Jan 29.

Epigenetic diversity of Kaposi's sarcoma-associated herpesvirus

Affiliations

Epigenetic diversity of Kaposi's sarcoma-associated herpesvirus

Russell P Darst et al. Nucleic Acids Res. .

Abstract

Spontaneous lytic reactivation of Kaposi's sarcoma-associated herpesvirus (KSHV) occurs at a low rate in latently infected cells in disease and culture. This suggests imperfect epigenetic maintenance of viral transcription programs, perhaps due to variability in chromatin structure at specific loci across the population of KSHV episomal genomes. To characterize this locus-specific chromatin structural diversity, we used MAPit single-molecule footprinting, which simultaneously maps endogenous CG methylation and accessibility to M.CviPI at GC sites. Diverse chromatin structures were detected at the LANA, RTA and vIL6 promoters. At each locus, chromatin ranged from fully closed to fully open across the population. This diversity has not previously been reported in a virus. Phorbol ester and RTA transgene induction were used to identify chromatin conformations associated with reactivation of lytic transcription, which only a fraction of episomes had. Moreover, certain chromatin conformations correlated with CG methylation patterns at the RTA and vIL6 promoters. This indicated that some of the diverse chromatin conformations at these loci were epigenetically distinct. Finally, by comparing chromatin structures from a cell line infected with constitutively latent virus, we identified products of lytic replication. Our findings show that epigenetic drift can restrict viral propagation by chromatin compaction at latent and lytic promoters.


Figures
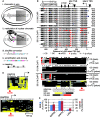
Figure 1.
Figure 1.
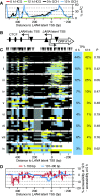
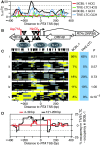
MAPit analysis of chromatin structural diversity. (A) MAPit workflow diagram, adapted from Darst et al. (13). Chromatin (e.g. nucleosomes) modulates accessibility of DNA sites to soluble proteins, such as (i) transcription factors (represented by shaded rectangle) in live cells, or (ii) exogenous M.CviPI DNMT in nuclei. Bisulfite treatment (iii) records M.CviPI accessibility pattern in the DNA sequence by conversion of unmethylated cytosine to uracil (cyan). Subsequent amplification and cloning (iv) allows recovery of this information from individual molecules. Note that endogenous and probe methylation sites are distinguished by sequence specificity of the respective DNMTs (respectively, cyan and magenta). The DNA sequences obtained are used to generate maps (v) of DNA methylation and accessibility. (B) MAPit at the KSHV gene LANA detected endogenous methylation and sporadic accessibility of the latent promoter. MAPit was performed in nuclei of BCBL1 cells. Top: map of genetic elements within the MAPit amplicon: LANA ORF (ORF73), three CTCF sites (ovals), lytic and latent TSSs (bent arrows) and TATA boxes (triangles). Middle: MethylViewer (22) display of MAPit results from control nuclei probed as indicated with 0 U or 30 U M.CviPI. Blue vertical ticks indicate positions of unconverted cytosines, excluding GC and CG sites (i.e. HCH); percent conversion of all HCH cytosines for each sequence clone is given on the right. Bottom (key): Circles and triangles, respectively, indicate CG and GC sites. Methylated sites are shaded. Methylated GCG sites are shaded gray to indicate their ambiguity; however, comparison of sequences from nuclei with and without M.CviPI treatment (middle, lower and upper panels) indicated that GCG sites within the LANA ORF were endogenously methylated. (C) Condensed view of the data in B, to scale with locus map at top. Each row of pixels represents one cloned sequence, i.e. molecule. Each plot tracks only GC or CG methylation; GCG sites are ignored. As indicated by key at bottom, spans of color mark ≥2 contiguous methylated sites; black marks ≥2 contiguous unmethylated sites; gray marks spans between methylated and unmethylated sites; white indicates missing or unaligned sequence. Positions of sites are indicated by circles and triangles (HCG and GCH, respectively). (D) Host promoters varied in degree of accessibility to M.CviPI. Maps of GC methylation at two representative promoters are shown, to scale with LANA amplicon. (E) MAPit at the three loci shown was semi-quantitative. At the HaeIII sites indicated in red at GAPDH, GRP78 and LANA, 10 of 20, 15 of 17 and 1 of 10 molecules had a methylated GC site, respectively (blue bars). R.HaeIII digestion followed by quantitative real-time PCR was used to measure bulk methylation of the same three sites in genomic DNA purified from M.CviPI-treated nuclei (red bars). Under these conditions, ∼95% of DNA from untreated nuclei (i.e. unmethylated) was digested (not shown). The concordance between BGS and R.HaeIII digest indicated that representation of methylated and unmethylated molecules in MAPit was unbiased.
Figure 2.
Figure 2.
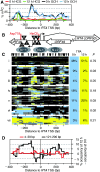
TPA treatment altered KLAR chromatin structure in ∼10% of BCBL1 episomes. Note that this KLAR amplicon, although overlapping the amplicon of Figure 1, was centered upstream to better observe accessible DNA at the latent TSS. (A) Profile of endogenous CG (0–h TPA treated, red; 12-h TPA treated, green) and exogenous GC methylation (0-h TPA treated, black; 12 h TPA treated, blue) across the locus. GCG sites were not counted. (B) Schematic of the analyzed amplicon. The LANA ORF begins left of the amplicon. The LANA latent and lytic TSSs are indicated. TATA boxes are indicated by triangles (upside down, latent and lytic LANA; righted, ORF K14). (C) All GC methylation plots for 0- and 12-h TPA treatment (blue and yellow, respectively), including GCG, as m5CG was rare in (A), were organized by unsupervised hierarchical clustering. GC sites are indicated above; plot is to scale with other panels. Dendrogram was split into nine fractions of interest. On right, proportion of sequence reads from each data set present in each cluster (columns do not sum to 100% owing to rounding). Expectation value P is the chance that as uneven a distribution of molecules from the two datasets would occur if molecules had been assigned to the cluster at random. (D) Difference in accessibility from 0- to 12-h of TPA treatment. Cumulative accessibility in two size ranges, 1–101 and 101–400 bp, was tallied at every position in each dataset, then the 0-h profile was subtracted from the 12-h profile.
Figure 3.
Figure 3.
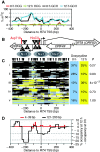
Induced lytic reactivation altered chromatin state frequency at RTA. (A) Profile of average endogenous CG (0-h TPA treatment, red; 12-h TPA treatment, green) and exogenous GC methylation (0-h TPA treatment, black; 12-h TPA treatment, blue) across the locus. GCG sites were not counted. Note locus of highest CG methylation coincided with a peak of GC methylation; elsewhere, CG methylation was minimal. (B) Diagram of RTA locus amplified. Triangles mark some of the known or suggested transcription factor–binding sites: C/EBP (C) (47), OCT-1 (O) (48), YY1 (Y) (49), AP-1 (A) (50), Sp1/3 (S) (2), XBP-1 (X) (51) and TATA (T). A second RTA TSS was recently reported roughly 500-bp upstream of this amplicon (52). Below, inferred nucleosome positions are indicated as two overlapping gray ovals, each 150-bp long. (C) Clustered GC methylation maps from 0-h (blue) and 12-h (yellow) treatment with TPA. Methylation of GC sites (including GCG, as m5CG was rare) was plotted as in Figure 1, to scale with panels (A, B and D). Position of GC sites is indicated by hashes at top. Maps from both data sets were sorted together by unsupervised, hierarchical clustering. Seven clusters of interest are presented. On right are given the proportion of sequence reads from each data set present in each cluster, and estimate of expectation value P assigned as in Figure 2. Columns do not sum to 100% due to rounding. (D) Difference in occupancy from 0 to 12 h of TPA treatment. Footprints in two size ranges, 4–39 and 121–200 bp, were counted at every position in each dataset, then the 0-h profile was subtracted from the 12-h profile. An intermediate size range, 40–120 bp, showed no difference between the data sets.
Figure 4.
Figure 4.
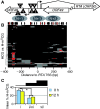
TPA treatment altered chromatin structure at the vIL6 gene in 10–15% of BCBL1 episomes. (A) Profile of average endogenous CG (0-h TPA treatment, red; 12-h TPA treatment, green) and exogenous GC methylation (0-h TPA treatment, black; 12-h TPA treatment, blue) across the locus. (B) Diagram of vIL6 locus amplified. Little has been reported of the structure of the vIL6 promoter, except for the two shown TSSs (bent arrows) (74). (C) All GC methylation plots for 0- and 12-h TPA treatment (blue and yellow, respectively, including GCG) were organized by unsupervised hierarchical clustering. GC sites are indicated above; plot is to scale with other panels. Dendrogram was split into five fractions of interest. On right, proportion of sequence reads from each data set present in each cluster, and expectation value P calculated as in Figure 2.
Figure 5.
Figure 5.
Expression of a doxycycline-inducible RTA transgene altered chromatin structure at the endogenous RTA promoter of 30–40% of episomes. (A) Profile of endogenous CG (uninduced, red; 12 h of doxycycline, green) and exogenous GC methylation (uninduced, black; 12 h of doxycycline, blue). GCG sites were not counted. (B) Schematic of the RTA locus, as in Figure 3B. (C) GC methylation plots for 0- and 12-h RTA induction (blue and yellow, respectively). GC sites are indicated above; plot is to scale with other panels. Dendrogram was split into five fractions of interest. On right, proportion of sequence reads from each data set present in each cluster, and expectation value P calculated, as in Figure 2. (D) Difference in footprint occupancy from 0 to 12 h of TPA treatment. Footprints in two size ranges, 4–39 and 121–200 bp, were counted at every position in each dataset, then the 0-h profile was subtracted from the 12-h profile.
Figure 6.
Figure 6.
Correlations between CG methylation and chromatin structure observed by MAPit. (A) Schematic of the analyzed amplicon. Symbols are as defined in Figure 3B. (B) CG methylation plot indicating localized patch of CG methylation upstream of RTA TSS. These are CG methylation plots of the same molecules as Figure 3C, 0-h treatment (not counting GCG). Unsupervised hierarchical clustering revealed that ∼25% of molecules shared a patch of CG methylation (red) ∼300 bp upstream of the RTA TSS. Positions of CG sites are indicated by hashes at top. (C) Link between CG methylation and MAPit structure at RTA. All molecules with 2–3 methylated CG sites within the linker were counted for each MAPit cluster defined in Figure 2C, as a percent of the total molecules in the cluster for each time point. Clusters ii–vi were grouped because some had as few as three molecules from a time point, increasing variance observed. Asterisk indicates data used to calculate P < 0.01 that constant CG methylation between clusters could generate observed distribution.
Figure 7.
Figure 7.
Chromatin structure at KLAR in TIVE-LTC compared with BCBL1 cells. (A) Schematic of the locus. The LANA ORF begins left of the amplicon. The latent and lytic TSSs are indicated. TATA boxes are indicated by triangles with orientations as in Figure 1A. (B) All GC methylation plots for BCBL1 and TIVE-LTC (yellow and blue, respectively, including GCG) were organized by unsupervised hierarchical clustering. GC sites are indicated above; plot is to scale with the other panel. Dendrogram was split into four fractions of interest. On right, proportion of sequence reads from each data set present in each cluster, and estimate of expectation value P calculated as in previous figures. Column for TIVE-LTC cells does not sum to 100% owing to rounding.
Figure 8.
Figure 8.
Silent chromatin at RTA promoter in TIVE-LTC cells. TPA-untreated BCBL1 MAPit reads from Figure 3 were compared with MAPit reads from TIVE-LTC cells. (A) Profile across RTA promoter of average endogenous CG (green) and exogenous GC (blue) methylation in TIVE-LTC cells, as well as CG (red) and exogenous GC (black) methylation in BCBL1 cells from Figure 2A for comparison. Note absence of ‘linker’ H-m5CG peak at −300 bp in TIVE-LTC cells, despite the presence of an overlapping G-m5CH peak, on left side of graph. (B) Diagram of RTA locus amplicon and inferred nucleosome positions, as in Figure 2, to scale with other panels. (C) Clustered GC (including GCG) methylation maps from BCBL1 (yellow) and TIVE-LTC (blue) presented as in Figure 2. Five clusters of interest are presented. On right, proportion of sequence reads from each data set present in each cluster, and estimate of expectation value P calculated as in Figure 2. (D) Difference in frequency of footprints of two size ranges from 0 to 12 h of TPA calculated as in Figure 2.
Figure 9.
Figure 9.
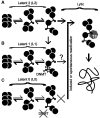
Model for three distinct epigenetic states of KSHV defined by MAPit at RTA promoter. (A) In the most open latent state, Latent 2 (L2), unfolding of higher-order chromatin structure transiently exposes the TSS and an upstream linker. With induced or spontaneous reactivation, transcription factors (polygon labeled TF) replace repressors (not shown) near the TSS. This leads to lytic replication, producing nucleosome-free DNA (far right). (B) The exposed linker in L2 can be CG methylated (triangles) by endogenous DNMTs. This methylation correlates with a shift to another epigenetic state, Latent 1 (L1), in which chromatin tends to be more closed. L1 virus responds to phorbol ester induction of lytic transcription weakly or not at all. (C) A third state, Latent 0 (L0), occurred in TIVE-LTC cells. Although in these cells, different stages of chromatin folding were observed, neither DNMTs nor transcription factors were able to access internucleosomal linker DNA, perhaps due to the presence (or absence) of specific histone modifications. L0 cannot be induced to reactivate by phorbol ester.

Similar articles

Cited by

References

    1. Ganem D. KSHV infection and the pathogenesis of Kaposi's sarcoma. Annu. Rev. Pathol. 2006;1:273–296. - PubMed
    1. Lu F, Zhou J, Wiedmer A, Madden K, Yuan Y, Lieberman PM. Chromatin remodeling of the Kaposi's sarcoma-associated herpesvirus ORF50 promoter correlates with reactivation from latency. J. Virol. 2003;77:11425–11435. - PMC - PubMed
    1. Günther T, Grundhoff A. The epigenetic landscape of latent Kaposi sarcoma-associated herpesvirus genomes. PLoS Pathog. 2010;6:e1000935. - PMC - PubMed
    1. Toth Z, Maglinte DT, Lee SH, Lee HR, Wong LY, Brulois KF, Lee S, Buckley JD, Laird PW, Marquez VE, et al. Epigenetic analysis of KSHV latent and lytic genomes. PLoS Pathog. 2010;6:e1001013. - PMC - PubMed
    1. Miller G, El-Guindy A, Countryman J, Ye J, Gradoville L. Lytic cycle switches of oncogenic human gammaherpesviruses. Adv. Cancer Res. 2007;97:81–109. - PubMed

Publication types

MeSH terms