

Notch signaling in chondrocytes modulates endochondral ossification and osteoarthritis development
- PMID: 23319657
- PMCID: PMC3562777
- DOI: 10.1073/pnas.1207458110
Notch signaling in chondrocytes modulates endochondral ossification and osteoarthritis development
Abstract
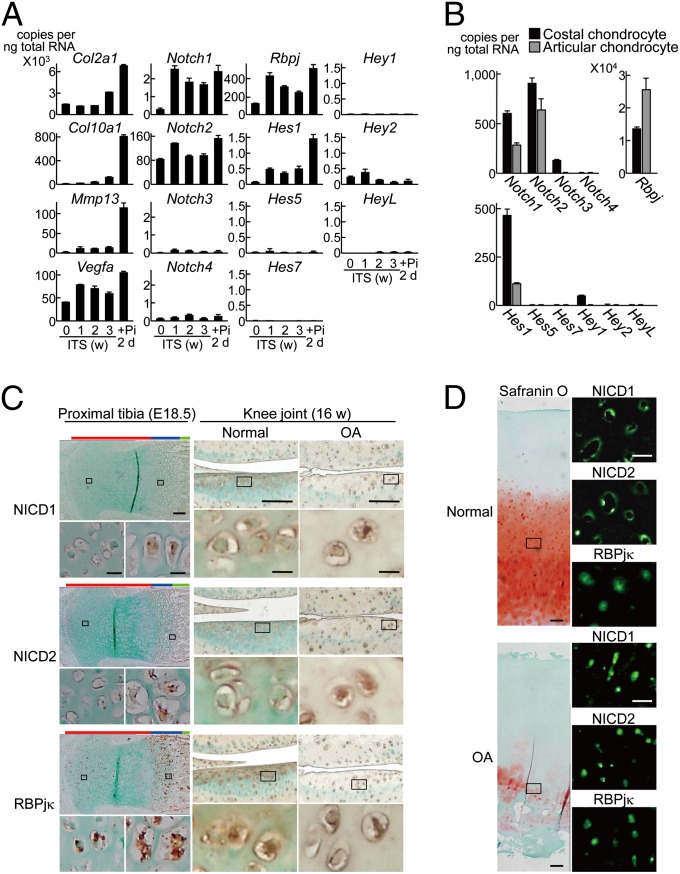
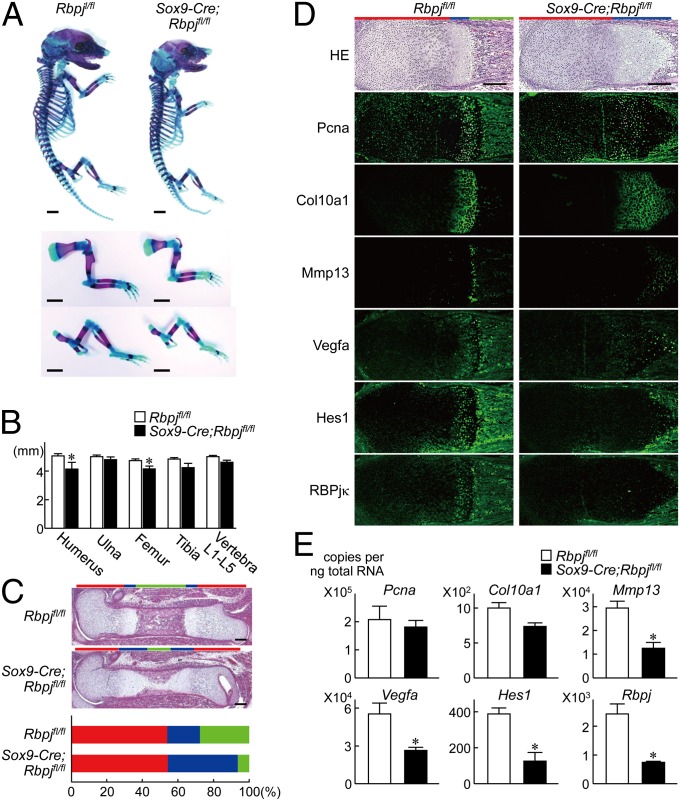
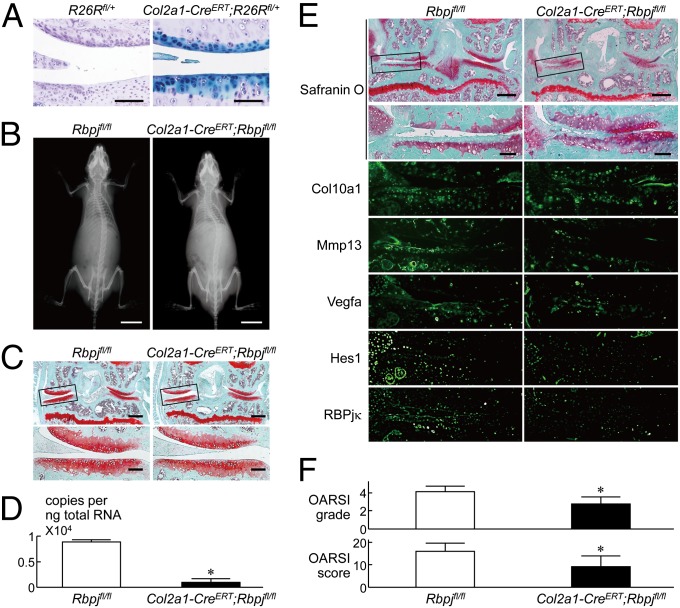
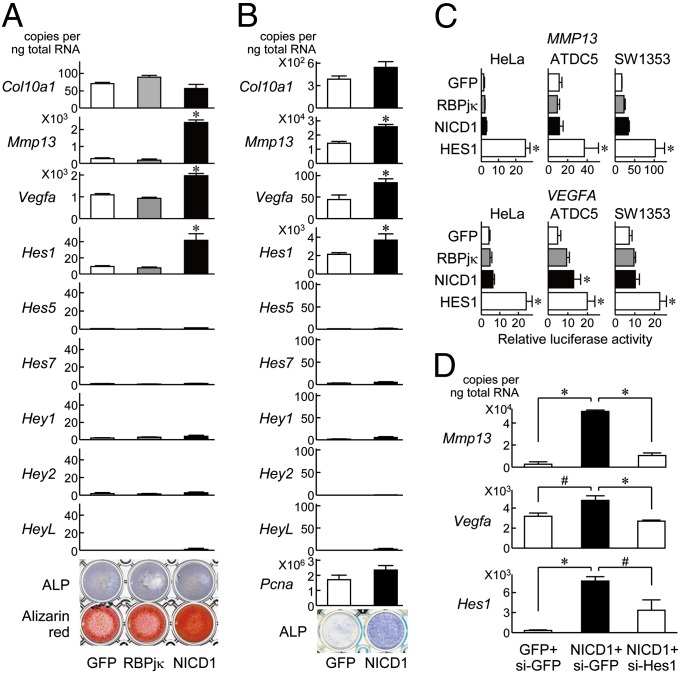
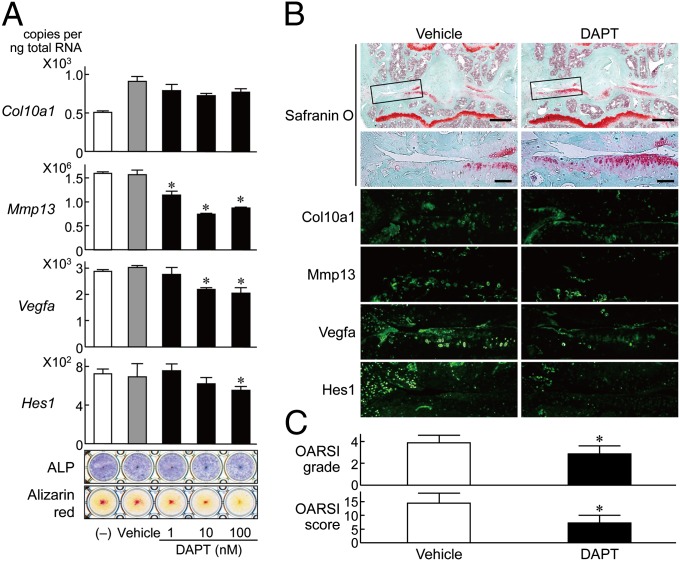
Here we examined the involvement of Notch signaling in the endochondral ossification process, which is crucial for osteoarthritis (OA) development. Intracellular domains of Notch1 and -2 were translocated into the nucleus of chondrocytes with their differentiation in mouse limb cartilage and in mouse and human OA articular cartilage. A tissue-specific inactivation of the Notch transcriptional effector recombination signal binding protein for Ig kappa J (RBPjκ) in chondroprogenitor cells of SRY-box containing gene 9 (Sox9)-Cre;Rbpj(fl/fl) mouse embryos caused an impaired terminal stage of endochondral ossification in the limb cartilage. The RBPjκ inactivation in adult articular cartilage after normal skeletal growth using type II collagen (Col2a1)-Cre(ERT);Rbpj(fl/fl) mice by tamoxifen injection caused resistance to OA development in the knee joint. Notch intracellular domain with the effector RBPjκ stimulated endochondral ossification through induction of the target gene Hes1 in chondrocytes. Among the Notch ligands, Jagged1 was strongly induced during OA development. Finally, intraarticular injection of N-[N-(3,5-diflurophenylacetate)-L-alanyl]-(S)-phenylglycine t-butyl ester (DAPT), a small compound Notch inhibitor, to the mouse knee joint prevented OA development. The RBPjκ-dependent Notch signaling in chondrocytes modulates the terminal stage of endochondral ossification and OA development, representing an extracellular therapeutic target of OA.
Conflict of interest statement
The authors declare no conflict of interest.
Figures
Similar articles
-
Notch1, Jagged1, and HES5 are abundantly expressed in osteoarthritis.Cells Tissues Organs. 2008;188(3):287-98. doi: 10.1159/000121610. Epub 2008 Mar 20. Cells Tissues Organs. 2008. PMID: 18354251
-
Transcription factor Hes1 modulates osteoarthritis development in cooperation with calcium/calmodulin-dependent protein kinase 2.Proc Natl Acad Sci U S A. 2015 Mar 10;112(10):3080-5. doi: 10.1073/pnas.1419699112. Epub 2015 Mar 2. Proc Natl Acad Sci U S A. 2015. PMID: 25733872 Free PMC article.
-
Notch-Hes1 pathway contributes to the cochlear prosensory formation potentially through the transcriptional down-regulation of p27Kip1.J Neurosci Res. 2009 Dec;87(16):3521-34. doi: 10.1002/jnr.22169. J Neurosci Res. 2009. PMID: 19598246
-
Role of Notch signaling pathway in gastric cancer: a meta-analysis of the literature.World J Gastroenterol. 2014 Jul 21;20(27):9191-9. doi: 10.3748/wjg.v20.i27.9191. World J Gastroenterol. 2014. PMID: 25083094 Free PMC article. Review.
-
Endochondral ossification signals in cartilage degradation during osteoarthritis progression in experimental mouse models.Mol Cells. 2008 Feb 29;25(1):1-6. Mol Cells. 2008. PMID: 18319608 Review.
Cited by
-
Signaling Pathways in Bone Development and Their Related Skeletal Dysplasia.Int J Mol Sci. 2021 Apr 21;22(9):4321. doi: 10.3390/ijms22094321. Int J Mol Sci. 2021. PMID: 33919228 Free PMC article. Review.
-
The Role of Cartilage Stem/Progenitor Cells in Cartilage Repair in Osteoarthritis.Curr Stem Cell Res Ther. 2023;18(7):892-903. doi: 10.2174/1574888X17666221006113739. Curr Stem Cell Res Ther. 2023. PMID: 36201278 Free PMC article.
-
BMP9 overexpressing adipose-derived mesenchymal stem cells promote cartilage repair in osteoarthritis-affected knee joint via the Notch1/Jagged1 signaling pathway.Exp Ther Med. 2018 Dec;16(6):4623-4631. doi: 10.3892/etm.2018.6754. Epub 2018 Sep 18. Exp Ther Med. 2018. PMID: 30542413 Free PMC article.
-
Complexities in Genetics of Psoriatic Arthritis.Curr Rheumatol Rep. 2020 Mar 12;22(4):10. doi: 10.1007/s11926-020-0886-x. Curr Rheumatol Rep. 2020. PMID: 32166449 Free PMC article. Review.
-
Notch Regulates Fibrocartilage Stem Cell Fate and Is Upregulated in Inflammatory TMJ Arthritis.J Dent Res. 2020 Sep;99(10):1174-1181. doi: 10.1177/0022034520924656. Epub 2020 May 22. J Dent Res. 2020. PMID: 32442041 Free PMC article.
References
-
- Kronenberg HM. Developmental regulation of the growth plate. Nature. 2003;423(6937):332–336. - PubMed
-
- Kawaguchi H. Endochondral ossification signals in cartilage degradation during osteoarthritis progression in experimental mouse models. Mol Cells. 2008;25(1):1–6. - PubMed
-
- Sharma L, Kapoor D. In: Osteoarthritis, Diagnosis and Medical/Surgical Management. 4th Ed. Moskowits RE, Altman RD, Hochberg MC, Buckwalter JA, Goldberg VM, editors. Philadelphia: Lippincott Williams & Wilkins; 2007. pp. 3–26.
Publication types
MeSH terms
Substances
LinkOut - more resources
Full Text Sources
Other Literature Sources
Medical
Molecular Biology Databases
Research Materials
