. 2013 Jan 24;38(1):187-97.
doi: 10.1016/j.immuni.2012.09.020. Epub 2012 Dec 20.

Distribution and compartmentalization of human circulating and tissue-resident memory T cell subsets

Affiliations

Distribution and compartmentalization of human circulating and tissue-resident memory T cell subsets

Taheri Sathaliyawala et al. Immunity. .

Abstract

Knowledge of human T cells derives chiefly from studies of peripheral blood, whereas their distribution and function in tissues remains largely unknown. Here, we present a unique analysis of human T cells in lymphoid and mucosal tissues obtained from individual organ donors, revealing tissue-intrinsic compartmentalization of naive, effector, and memory subsets conserved between diverse individuals. Effector memory CD4(+) T cells producing IL-2 predominated in mucosal tissues and accumulated as central memory subsets in lymphoid tissue, whereas CD8(+) T cells were maintained as naive subsets in lymphoid tissues and IFN-γ-producing effector memory CD8(+) T cells in mucosal sites. The T cell activation marker CD69 was constitutively expressed by memory T cells in all tissues, distinguishing them from circulating subsets, with mucosal memory T cells exhibiting additional distinct phenotypic and functional properties. Our results provide an assessment of human T cell compartmentalization as a new baseline for understanding human adaptive immunity.


Figures

Figure 1
Figure 1. Lymphocyte subset frequency is intrinsic to the tissue site within and between individuals
Lymphocytes were isolated from the tissues indicated in Table 1 and analyzed by flow cytometry. (A) Representative flow cytometry plots showing CD3 and CD20 expression, indicating T and B cell subsets, respectively, gated on forward and side scatter lymphocyte populations. Tissue designations from left to right: BLD, blood; LLN, lung lymph node; JEJ, jejunum; SPL, spleen; LUN, lung; ILE, ileum; ILN, inguinal lymph node; MLN, mesenteric lymph node; COL, colon. Data derive from Donor 3. (B) Upper: Graph shows relative T and B cell frequency in the nine tissue sites compiled from 14 donors (donor #’s 1–4, 7–10, 12, 13, 20, 27, 33, 40), plotted as the ratio of T:B cell frequency in each tissue site ±SEM. Lower: CD4+ and CD8+ T cell subset composition in different human tissue sites calculated as the mean ratio CD4+:CD8+ T cell frequency ±SEM within CD3+ cells from 17 individual donors (donor #’s 1–4, 7–10, 12, 13, 16, 18, 26, 27, 33, 39, 40). Individualized datasets for each donor are shown in Table S1.
Figure 2
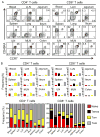
Figure 2. Memory T cells predominate throughout the body and vary with age in lymphoid compartments
Lymphocytes isolated from indicated donor tissues were analyzed for CD45RO expression to delineate memory cells from CD45RA-expressing subsets representing either naïve or terminal effector cells. (A) Representative flow cytometry analysis of CD45RA and CD45RO expression from CD4+ T cells (left) and CD8+ T cells (right) from Donor 39, aged 32. Tissue designations from left to right: BLD, blood; LLN, lung lymph node; JEJ, jejunum; SPL, spleen; LUN, lung; ILE, ileum; ILN, inguinal lymph node; MLN, mesenteric lymph node; COL, colon. (B) Change in memory T cell frequency and distribution in different age groups. Plots show the mean frequency (±SEM) of memory (CD45RO+) CD4+ (left) and CD8+ (right) T cells in different tissues compiled from individuals of 3 age groupings: young (<20yrs; n=5), middle (30–50yrs, n=7) and older (50–60yrs, n=5). Differences in the overall proportion of memory CD4 T cells is highly significant (***) comparing the <20 to the 30–50yr (p=3×10⁻⁷) or comparing the <20 to the 51–60yr group (p=0.0005), but not significant comparing the 30–50yr to the 51–60yr groups (p=0.57). For CD8+ T cells, differences in the proportion of memory T cells was significant (**) comparing the <20yr to the 30–50yr (p=0.003), or to the 51–60yr group (p=0.04), but not significant between the 30–50yr and 51–60yr groups (p=0.33). CD45RO frequency for each of the 17 donors analyzed (donor #’s 1, 2, 3, 7, 8, 9, 10, 12, 13, 16, 18, 20, 27, 29, 33, 39, 40) is shown in Table S1.
Figure 3
Figure 3. Distinct tissue distribution and subset composition of naïve, memory and terminal effector CD4+ and CD8+ T cell subsets
(A) Coordinate expression of CD45RA and CCR7 by CD4+ (left) and CD8+ (Right) T cells in blood and 8 tissue sites delineates four subsets corresponding to naïve (CD45RA+CCR7+, upper right quadrant), terminal effector (Temra, CD45RA+CCR7, upper left quadrant), central memory (Tcm, CD45RACCR7+, lower right quadrant), effector-memory (Tem, CD45RACCR7, lower left quadrant). Results shown are from Donor 41, representative of nine donors. (B) Frequency of naïve (red), Temra (black), Tcm (yellow) and Tem (grey) CD4+ (left) and CD8+ (right) T cell subsets in each tissue site, compiled from nine donors (donor #’s 3, 15, 39, 40, 41, 42, 43, 44, 45; individualized datasets for each donor shown in Table S2). Small individual graphs show frequency of each subset in each site expressed as mean±SEM, calculated from dot plots as in (A). Lower: Large composite graphs show average frequency of each subset (naïve, Temra, Tcm, Tem) within CD4+ (left) or CD8+ (right) T cells in each tissue site.
Figure 4
Figure 4. CD69 expression distinguishes tissue-resident from circulating memory T cell subsets
(A) Mean frequency (±SEM) of CD69+ T cells gated on CD45RA+ (red bars) and CD45RO+ (blue bars) CD4+ (left) and CD8+ (right) T cells in blood and tissues compiled from 19 donors (donor #’s 1, 7, 8, 9, 10, 12, 13,14,15, 27, 29, 33, 39, 40, 41, 42, 43, 44, 45; individual frequencies from each tissue of each donor are shown in Table S3, top portion). (B) IL-7 receptor (CD127) is expressed by the majority of CD69+ tissue-resident memory T cells in lymphoid and mucosal sites. Flow cytometry plots show CD127 expression as a function of CD69 expression gated on CD45RO+ CD4+ (upper) or CD8+ (lower) T cells in blood and indicated tissue sites. Results are from Donor 41 and representative of five donors. (C) CCR7 and CD69 expression by CD45RO+ CD4+ (upper row) and CD8+ (lower row) T cells delineates four subsets: circulating central memory (Tcm:CCR7+CD69), circulating effector-memory (Tem:CCR7CD69) cells, resident Tcm (rTcm:CCR7+CD69+) and resident Tem (rTem:CCR7CD69+) subsets (see leftmost quadrant diagram). Results are from Donor 39 and representative of seven donors.
Figure 5
Figure 5. The integrin CD103 (αEβ7) specifically marks mucosal CD8 T cells
(A) Expression of CD103 by CD45RO+ (blue histogram) and CD45RA+(red-filled histogram) CD4+ (left) and CD8+ (right) T cells from blood and 8 tissue sites. Results are shown from Donor 40 and are representative of 11 donors. (B) CD103 expression on CD45RO+ and CD45RA+ CD4+ (left) and CD8+ (right) T cells shown as percent CD103+ for each subset from each tissue site compiled from 11 donors (donor #’s 1, 7, 8, 9, 10, 12, 13, 14, 15, 27, 29, 33; individual frequencies for each donor in each site are presented in Table S3, lower part).
Figure 6
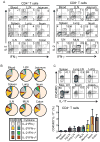
Figure 6. Functional profile of T cells in lymphoid and mucosal tissues
T cells purified from indicated tissue sites were stimulated for 4hrs with PMA/ionomycin and cytokine production was assessed by intracellular cytokine staining (ICS). (A) IFN-γ and IL-2 production by CD4+ and CD8+ T cells in different tissue sites, with gates drawn based on unstimulated controls. Numbers in quadrants indicates percent of CD4+ T cells (left) or CD8+ T cells (right) producing IFN-γ, IL-2 or both cytokines. Results are from Donor 29, representative of four donors (#18, 26, 27, and 29) from which coordinate analysis of IFN-γ and IL-2 production was accomplished. (B) Individual pie chart diagrams showing the frequency of CD4+ and CD8+ T cells with rapid cytokine producing capacity in each tissue site from one donor, representative of four donors, showing a high proportion of quiescent CD4+ T cells in each site and a minority population of effector-memory CD4+ or CD8+ T cells. (C) IL-17 production is confined to memory CD4+ T cells in mucosal sites. Upper: Representative ICS analysis of IL-17 production from spleen, mucosal draining LN, lung and intestinal sites from Donor 9. Lower: Mean IL-17 production (±SEM) from blood and tissue of five donors where we analyzed IL-17 expression (Donor #’s 9, 10, 18, 26, 27).

Comment in

Similar articles

Cited by

References

    1. Bentebibel SE, Schmitt N, Banchereau J, Ueno H. Human tonsil B-cell lymphoma 6 (BCL6)-expressing CD4+ T-cell subset specialized for B-cell help outside germinal centers. Proc Natl Acad Sci U S A. 2011;108:E488–497. - PMC - PubMed
    1. Bevan MJ. Memory T cells as an occupying force. Eur J Immunol. 2011;41:1192–1195. - PMC - PubMed
    1. Campbell DJ, Debes GF, Johnston B, Wilson E, Butcher EC. Targeting T cell responses by selective chemokine receptor expression. Semin Immunol. 2003;15:277–286. - PubMed
    1. Casey KA, Fraser KA, Schenkel JM, Moran A, Abt MC, Beura LK, Lucas PJ, Artis D, Wherry EJ, Hogquist K, et al. Antigen-Independent Differentiation and Maintenance of Effector-like Resident Memory T Cells in Tissues. J Immunol. 2012;188:4866–4875. - PMC - PubMed
    1. Clark RA, Watanabe R, Teague JE, Schlapbach C, Tawa MC, Adams N, Dorosario AA, Chaney KS, Cutler CS, Leboeuf NR, et al. Skin effector memory T cells do not recirculate and provide immune protection in alemtuzumab-treated CTCL patients. Sci Transl Med. 2012;4:117ra117. - PMC - PubMed

Publication types

MeSH terms