

Tight junction proteins claudin-3 and claudin-4 control tumor growth and metastases
- PMID: 23097631
- PMCID: PMC3479841
- DOI: 10.1593/neo.12942
Tight junction proteins claudin-3 and claudin-4 control tumor growth and metastases
Abstract
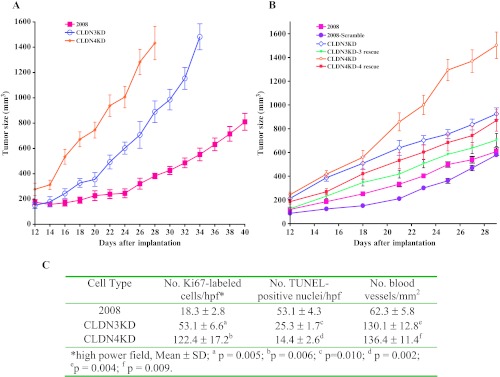
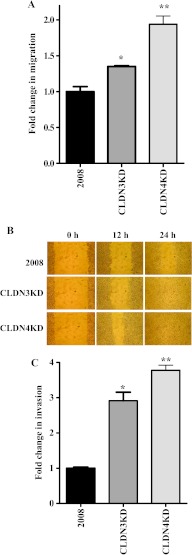
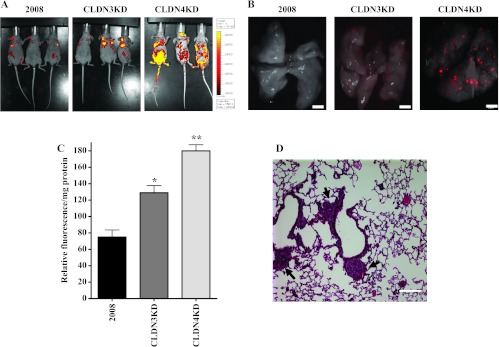
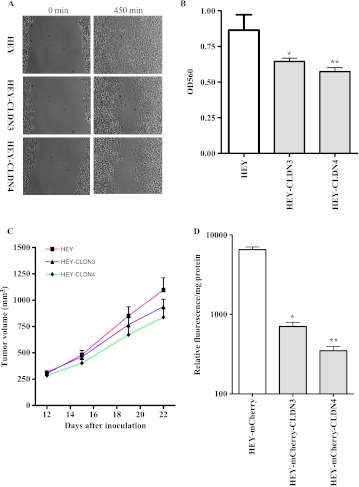
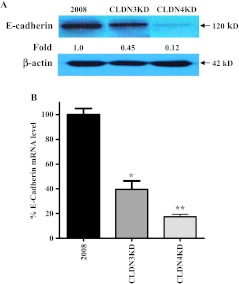
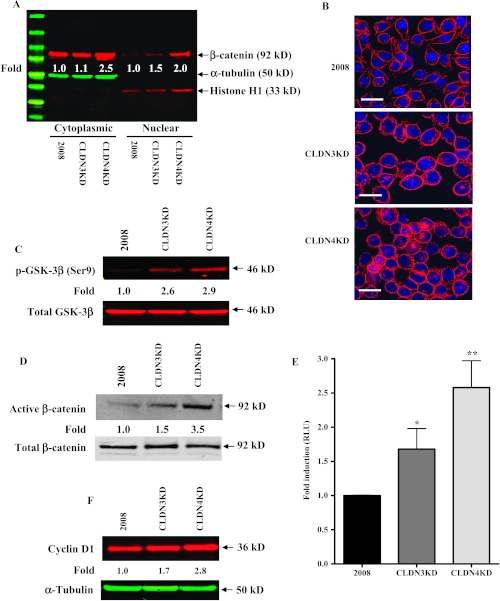
The extent of tight junction (TJ) formation is one of many factors that regulate motility, invasion, and metastasis. Claudins are required for the formation and maintenance of TJs. Claudin-3 (CLDN3) and claudin-4 (CLDN4) are highly expressed in the majority of ovarian cancers. We report here that CLDN3 and CLDN4 each serve to constrain the growth of human 2008 cancer xenografts and limit metastatic potential. Knockdown of CLDN3 increased in vivo growth rate by 2.3-fold and knockdown of CLDN4 by 3.7-fold in the absence of significant change in in vitro growth rate. Both types of tumors exhibited increase in birth rate as measured by Ki67 staining and decrease in death rate as reflected by terminal deoxynucleotidyl transferase dUTP nick end labeling (TUNEL) staining. Knockdown of either claudin did not alter expression of other TJ protein but did reduce TJ formation as measured by transepithelial resistance and paracellular flux of dextran, enhance migration and invasion in in vitro assays, and increase lung colonization following intravenous injection. Knockdown of CLDN3 and CLDN4 increased total lung metastatic burden by 1.7-fold and 2.4-fold, respectively. Loss of either CLDN3 or CLDN4 resulted in down-regulation of E-cadherin mRNA and protein, increased inhibitory phosphorylation of glycogen synthase kinase-3β (GSK-3β), and activation of β-catenin pathway signaling as evidenced by increases in nuclear β-catenin, the dephosphorylated form of the protein, and transcriptional activity of β-catenin/T-cell factor (TCF). We conclude that both CLDN3 and CLDN4 mediate interactions with other cells in vivo that restrain growth and metastatic potential by sustaining expression of E-cadherin and limiting β-catenin signaling.
Figures

Similar articles
-
Regulation of the Epithelial-Mesenchymal Transition by Claudin-3 and Claudin-4.PLoS One. 2013 Jun 21;8(6):e67496. doi: 10.1371/journal.pone.0067496. Print 2013. PLoS One. 2013. PMID: 23805314 Free PMC article.
-
Claudin-3 and claudin-4 regulate sensitivity to cisplatin by controlling expression of the copper and cisplatin influx transporter CTR1.Mol Pharmacol. 2013 Jan;83(1):85-94. doi: 10.1124/mol.112.079798. Epub 2012 Oct 10. Mol Pharmacol. 2013. PMID: 23053666
-
Potential roles of claudin-3 and claudin-4 in ovarian cancer management.J Egypt Natl Canc Inst. 2022 Jun 6;34(1):24. doi: 10.1186/s43046-022-00125-4. J Egypt Natl Canc Inst. 2022. PMID: 35665865 Review.
-
Cytotoxicity of Clostridium perfringens enterotoxin depends on the conditions of claudin-4 in ovarian carcinoma cells.Exp Cell Res. 2018 Oct 1;371(1):278-286. doi: 10.1016/j.yexcr.2018.08.024. Epub 2018 Aug 22. Exp Cell Res. 2018. PMID: 30142326
-
Claudin-4: A New Molecular Target for Epithelial Cancer Therapy.Int J Mol Sci. 2023 Mar 13;24(6):5494. doi: 10.3390/ijms24065494. Int J Mol Sci. 2023. PMID: 36982569 Free PMC article. Review.
Cited by
-
Nuclear receptor FXR impairs SK-Hep-1 cell migration and invasion by inhibiting the Wnt/β-catenin signaling pathway.Oncol Lett. 2020 Nov;20(5):161. doi: 10.3892/ol.2020.12022. Epub 2020 Aug 26. Oncol Lett. 2020. PMID: 32934729 Free PMC article.
-
Claudin-4 activity in ovarian tumor cell apoptosis resistance and migration.BMC Cancer. 2016 Oct 11;16(1):788. doi: 10.1186/s12885-016-2799-7. BMC Cancer. 2016. PMID: 27724921 Free PMC article.
-
Tight Junction Proteins and Signaling Pathways in Cancer and Inflammation: A Functional Crosstalk.Front Physiol. 2019 Jan 23;9:1942. doi: 10.3389/fphys.2018.01942. eCollection 2018. Front Physiol. 2019. PMID: 30728783 Free PMC article. Review.
-
CLDN3 inhibits cancer aggressiveness via Wnt-EMT signaling and is a potential prognostic biomarker for hepatocellular carcinoma.Oncotarget. 2014 Sep 15;5(17):7663-76. doi: 10.18632/oncotarget.2288. Oncotarget. 2014. PMID: 25277196 Free PMC article.
-
Integration and bioinformatics analysis of DNA-methylated genes associated with drug resistance in ovarian cancer.Oncol Lett. 2016 Jul;12(1):157-166. doi: 10.3892/ol.2016.4608. Epub 2016 May 18. Oncol Lett. 2016. PMID: 27347118 Free PMC article.
References
-
- Matter K, Balda MS. Signalling to and from tight junctions. Nat Rev Mol Cell Biol. 2003;4:225–236. - PubMed
-
- Schneeberger EE, Lynch RD. The tight junction: a multifunctional complex. Am J Physiol Cell Physiol. 2004;286:C1213–C1228. - PubMed
-
- Langbein L, Pape UF, Grund C, Kuhn C, Praetzel S, Moll I, Moll R, Franke WW. Tight junction-related structures in the absence of a lumen: occludin, claudins and tight junction plaque proteins in densely packed cell formations of stratified epithelia and squamous cell carcinomas. Eur J Cell Biol. 2003;82:385–400. - PubMed
-
- Mullin JM. Epithelial barriers, compartmentation, and cancer. Sci STKE. 2004;2004:pe2. - PubMed