

Linking the signaling cascades and dynamic regulatory networks controlling stress responses
- PMID: 23064748
- PMCID: PMC3561877
- DOI: 10.1101/gr.138628.112
Linking the signaling cascades and dynamic regulatory networks controlling stress responses
Abstract
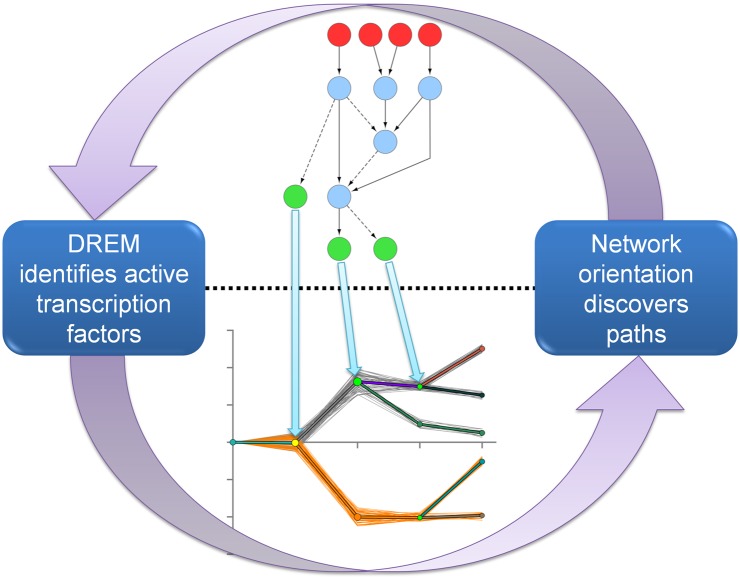
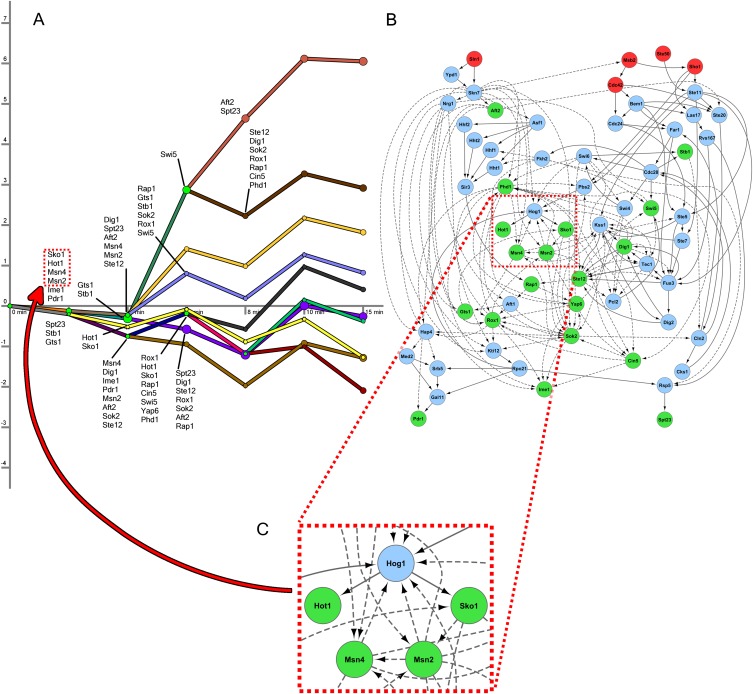
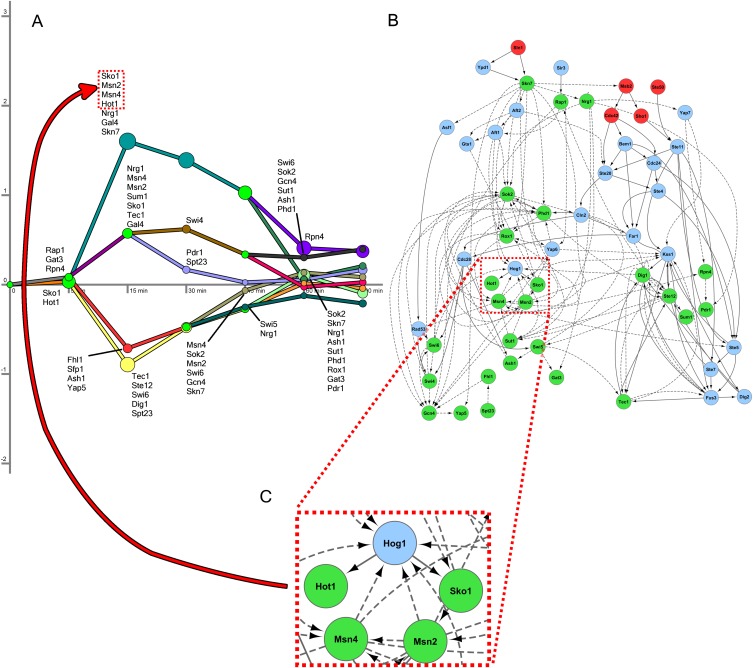
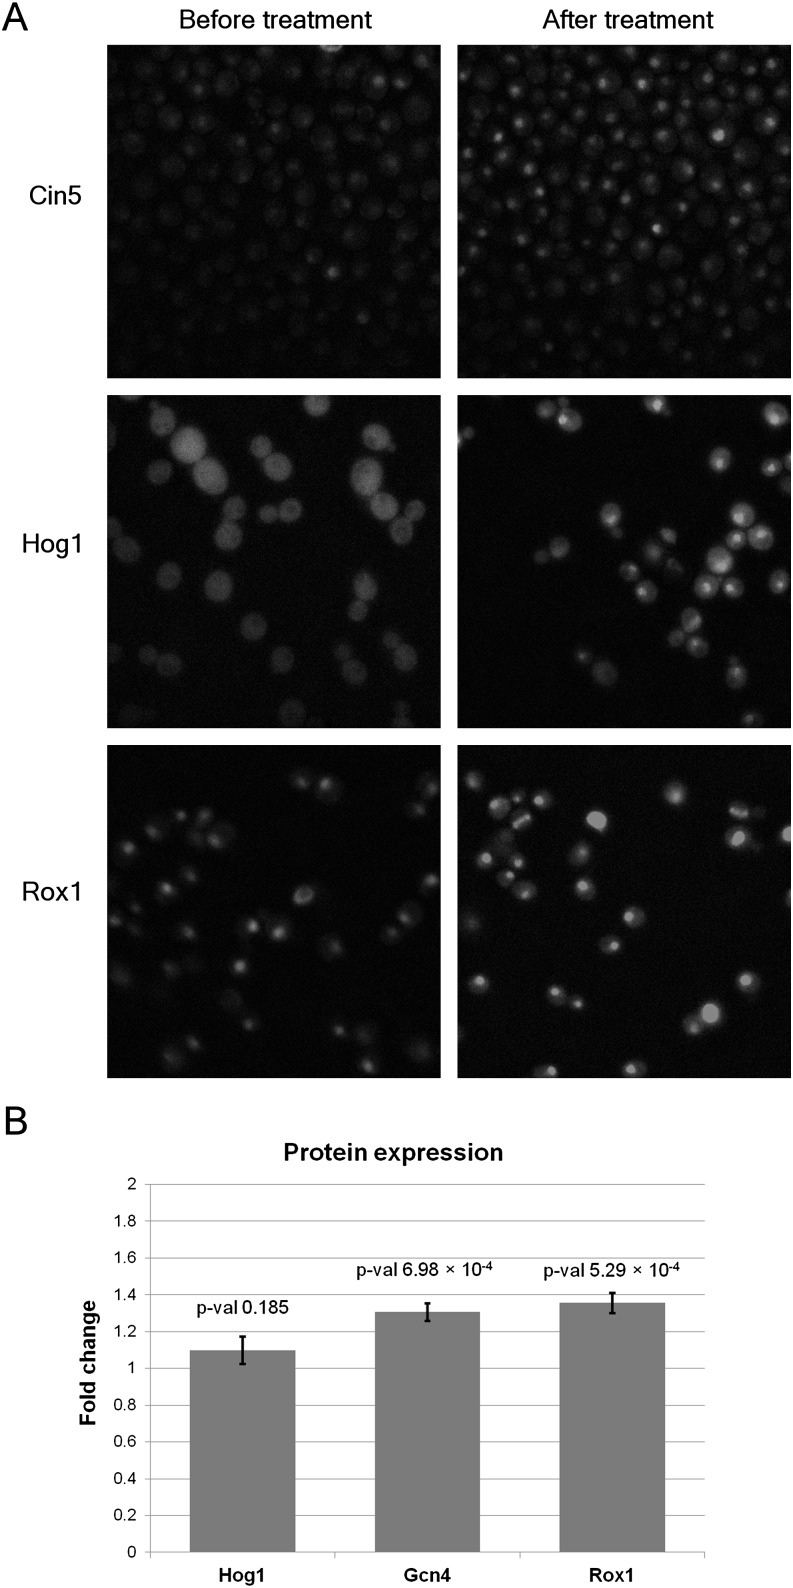
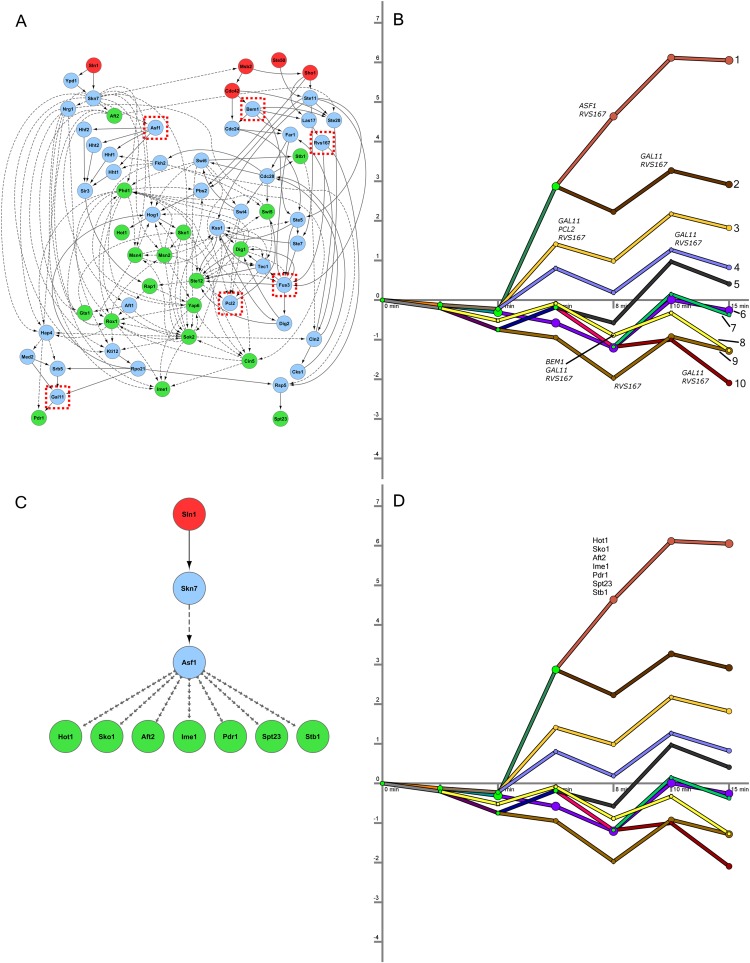
Accurate models of the cross-talk between signaling pathways and transcriptional regulatory networks within cells are essential to understand complex response programs. We present a new computational method that combines condition-specific time-series expression data with general protein interaction data to reconstruct dynamic and causal stress response networks. These networks characterize the pathways involved in the response, their time of activation, and the affected genes. The signaling and regulatory components of our networks are linked via a set of common transcription factors that serve as targets in the signaling network and as regulators of the transcriptional response network. Detailed case studies of stress responses in budding yeast demonstrate the predictive power of our method. Our method correctly identifies the core signaling proteins and transcription factors of the response programs. It further predicts the involvement of additional transcription factors and other proteins not previously implicated in the response pathways. We experimentally verify several of these predictions for the osmotic stress response network. Our approach requires little condition-specific data: only a partial set of upstream initiators and time-series gene expression data, which are readily available for many conditions and species. Consequently, our method is widely applicable and can be used to derive accurate, dynamic response models in several species.
Figures
Similar articles
-
Integrating transcriptional and protein interaction networks to prioritize condition-specific master regulators.BMC Syst Biol. 2015 Nov 14;9:80. doi: 10.1186/s12918-015-0228-1. BMC Syst Biol. 2015. PMID: 26576632 Free PMC article.
-
Quantitative inference of dynamic regulatory pathways via microarray data.BMC Bioinformatics. 2005 Mar 7;6:44. doi: 10.1186/1471-2105-6-44. BMC Bioinformatics. 2005. PMID: 15748298 Free PMC article.
-
Refining current knowledge on the yeast FLR1 regulatory network by combined experimental and computational approaches.Mol Biosyst. 2010 Dec;6(12):2471-81. doi: 10.1039/c004881j. Epub 2010 Oct 11. Mol Biosyst. 2010. PMID: 20938527
-
Exploiting the yeast stress-activated signaling network to inform on stress biology and disease signaling.Curr Genet. 2015 Nov;61(4):503-11. doi: 10.1007/s00294-015-0491-0. Epub 2015 May 10. Curr Genet. 2015. PMID: 25957506 Free PMC article. Review.
-
Signal transduction during cold, salt, and drought stresses in plants.Mol Biol Rep. 2012 Feb;39(2):969-87. doi: 10.1007/s11033-011-0823-1. Epub 2011 May 15. Mol Biol Rep. 2012. PMID: 21573796 Review.
Cited by
-
ViralLink: An integrated workflow to investigate the effect of SARS-CoV-2 on intracellular signalling and regulatory pathways.PLoS Comput Biol. 2021 Feb 3;17(2):e1008685. doi: 10.1371/journal.pcbi.1008685. eCollection 2021 Feb. PLoS Comput Biol. 2021. PMID: 33534793 Free PMC article.
-
Reconstructed signaling and regulatory networks identify potential drugs for SARS-CoV-2 infection.bioRxiv [Preprint]. 2021 Dec 9:2020.06.01.127589. doi: 10.1101/2020.06.01.127589. bioRxiv. 2021. PMID: 33083801 Free PMC article. Preprint.
-
Integrating Transcriptomic and Proteomic Data Using Predictive Regulatory Network Models of Host Response to Pathogens.PLoS Comput Biol. 2016 Jul 12;12(7):e1005013. doi: 10.1371/journal.pcbi.1005013. eCollection 2016 Jul. PLoS Comput Biol. 2016. PMID: 27403523 Free PMC article.
-
NetConfer: a web application for comparative analysis of multiple biological networks.BMC Biol. 2020 May 19;18(1):53. doi: 10.1186/s12915-020-00781-9. BMC Biol. 2020. PMID: 32430035 Free PMC article.
-
Archetypal transcriptional blocks underpin yeast gene regulation in response to changes in growth conditions.Sci Rep. 2018 May 21;8(1):7949. doi: 10.1038/s41598-018-26170-5. Sci Rep. 2018. PMID: 29785040 Free PMC article.
References
-
- Balasubramaniyan R, Hullermeier E, Weskamp N, Kamper J 2005. Clustering of gene expression data using a local shape-based similarity measure. Bioinformatics 21: 1069–1077 - PubMed
-
- Bengio Y, Frasconi P 1995. An input output HMM architecture. Adv Neural Inf Process Syst 7: 427–434
Publication types
MeSH terms
Substances
Associated data
- Actions
Grants and funding
LinkOut - more resources
Full Text Sources
Molecular Biology Databases