. 2012;7(9):e46306.
doi: 10.1371/journal.pone.0046306. Epub 2012 Sep 25.

NAP1-assisted nucleosome assembly on DNA measured in real time by single-molecule magnetic tweezers

Affiliations

NAP1-assisted nucleosome assembly on DNA measured in real time by single-molecule magnetic tweezers

Rifka Vlijm et al. PLoS One. 2012.

Abstract

While many proteins are involved in the assembly and (re)positioning of nucleosomes, the dynamics of protein-assisted nucleosome formation are not well understood. We study NAP1 (nucleosome assembly protein 1) assisted nucleosome formation at the single-molecule level using magnetic tweezers. This method allows to apply a well-defined stretching force and supercoiling density to a single DNA molecule, and to study in real time the change in linking number, stiffness and length of the DNA during nucleosome formation. We observe a decrease in end-to-end length when NAP1 and core histones (CH) are added to the dsDNA. We characterize the formation of complete nucleosomes by measuring the change in linking number of DNA, which is induced by the NAP1-assisted nucleosome assembly, and which does not occur for non-nucleosomal bound histones H3 and H4. By rotating the magnets, the supercoils formed upon nucleosome assembly are removed and the number of assembled nucleosomes can be counted. We find that the compaction of DNA at low force is about 56 nm per assembled nucleosome. The number of compaction steps and associated change in linking number indicate that NAP1-assisted nucleosome assembly is a two-step process.


Conflict of interest statement

Competing Interests: The authors have declared that no competing interests exist.

Figures

Figure 1
Figure 1. Single-molecule magnetic tweezers (side view in x-z plane).
A The left diagram shows how an individual double-stranded DNA molecule with DIG labels is tethered to an antiDIG-coated glass surface while at the other end of the DNA, biotin labels attach to a streptavidin-coated magnetic bead. Two magnets above the bead apply a force on the DNA. After flushing in NAP1 preincubated with core histones, nucleosomes are assembled on the DNA, as illustrated in the middle panel. Since nucleosome formation locally winds the DNA around the histone core, positive supercoils are formed in the free DNA because its two ends are torsionally constrained. When the magnets are rotated within the x-y plane, the supercoiling state can be changed as shown in the right panel where the induced supercoils are removed again. B Rotation curve at a constant force of 0.3 pN. C When a nucleosome is formed from a histone octamer (orange) and DNA (black line), 146 bp (50 nm) of DNA is wrapped in 1.7 turns. The green crosses mark the DNA entry/exit points that are 6 nm apart from each other in the nucleosome. Note that also the finite angle at which the DNA comes out of the nucleosome, which results in a further decrease in end-to-end length.
Figure 2
Figure 2. Time traces of the end-to-end length of DNA.
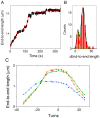
In Figures A–E the original DNA end-to-end length before the flush is shown and the force denotes the force applied directly after the flush. During the time when the proteins are flushed in, a higher force (>10 pN) is applied to the bead. Blue lines show the time-averaged data in a moving 100-point average. A NAP1 only: End-to-end length of a single DNA molecule (height of the magnetic bead) as a function of time. The red line shows raw data at full 100 Hz bandwidth. When a constant 0.3 pN force is applied, the DNA end-to-end length is constant, apart from fluctuations due to Brownian motion. At time t = 0 s the force is again lowered to 0.3 pN, immediately after 3.9 nM NAP1 is flushed in. The end-to-end length of the DNA molecule remains constant after the proteins are flushed in. B NAP1, H2A/H2B: At t = 0 s the force is lowered to 0.3 pN, immediately after 3.9 nM NAP1 preincubated with 2.6 nM H2A and 2.6 nM H2B is flushed in. The end-to-end length of the DNA molecule is constant, even after the proteins are flushed in. C NAP1, H3/H4: At time t = 0 s the force is lowered to 0.3 pN, immediately after 5.6 nM NAP1 preincubated with 1.6 nM H3 and 1.6 nM H4 is flushed in. The end-to-end length decreases in an exponential way until a plateau is reached at 66% of the initial length of the DNA. D NAP1, all 4 core histones, high concentration: At time t = 0 s the force is lowered to 0.7 pN, immediately after 4.8 nM NAP1 preincubated with 12 nM core histones (3 nM of each) is flushed in. The end-to-end length of this coilable molecule decreases instantly in an exponential way until a plateau is reached at 20% of it's original length. E NAP1, all 4 core histones, nicked DNA molecule: At time t = 0 s the force is lowered to 0.3 pN, immediately after 1.55 nM NAP1 preincubated with 2.1 nM core histones is flushed in. Since this molecule is nicked, no supercoils can be formed. Again, a length decrease is observed. F NAP1, all 4 core histones, coilable DNA molecule: Same as in E, but in this example the molecule did not have a nick, so supercoils were formed upon nucleosome assembly. G High force assembly: At time t = 0 s the force is lowered to 1 pN, immediately after 8.6 nM NAP1 preincubated with 11.2 nM core histones is flushed in. Under this higher force of 1 pN, the assembly curve displays individual steps. Blue line shows the tace of the end-to-end length of a nicked molecule; red shows the steps fitted with the step-finder algorithm . H Step histogram: This experiment in G is repeated for a number of coilable and nicked molecules. They both show a very similar stepping behaviour. The fitted steps of several protein flushes of 5 different molecules are analized with the step-finder algorithm and the result is shown in the histogram. Fitting a Gaussian distribution to the data, two peaks appear (two gaussian fitts in green add up to the total represented by the black line). The most important peak is at −27 nm steps (FWHM = 16 nm); a second smaller peak appears at −46 nm (FWHM = 8 nm).
Figure 3
Figure 3. Assembly, change in supercoiling and disassembly on the same molecule.
A Assembly of NAP1 assisted nucleosomes measured at 1 pN. Data (1 Hz) is shown in black: steps deduced by the step-finder software are shown in red. 12 assembly steps are observed with an average step size of −31 nm. B Rotation curve before (red) and after (blue) assembly of nucleosomes. The green curve is measured after pulling at high force. The shift between the red and the blue curve is −7±2. C High force disassembly of nucleosomes. The stretching force applied to the molecule is stepwise increased from 3 pN to 17.3 pN, in order to measure both the first and the second disruption event. No steps occurred at the lowest (3 pN) and highest (17.3 pN). A total number of 13 steps is observed, with an average step size of 25±10 nm.
Figure 4
Figure 4. Assembly-induced changes in the rotation curve.
A NAP1 addition: Rotation curves before (red squares) and after (blue circles) a flush of 3.9 nM NAP1 (the experiment from Figure 2A). NAP1 is observed to have no effect on the end-to-end length or on the linking numer. B NAP1, H2AH2B addition: Rotation curves before (red squares) and after (blue circles) a flush of 3.9 nM NAP1 preincubated with 2.6 nM H2A and 2.6 nM H2B (the experiment from Figure 2B). NAP1 and H2A/H2B have almost no effect on the end-to-end length or on the linking numer. C NAP1, H3/H4 addition: The rotation curves before (red squares) and after (blue circles) 5.6 nM NAP1 preincubated with 1.6 nM H3 and 1.6 nM H4 is flushed in (experiment as shown in Figure 2C). H3 and H4 do decrease the end-to-end length and broaden the rotation curve, but do not change the linking number (i.e., do not induce a horizontal shift in the position of the rotation curve). D NAP1, all 4 histones: The rotation curves before (red squares) and after (blue circles) 1.55 nM NAP1 preincubated with 2.1 nM core histones is flushed in (experiment as shown in Figure 2F). NAP1 incubated with all 4 core histones induces positive supercoils and decreases the DNA end-to-end length. At point a, the maximum of the rotation curve before assembly, ΔLk = 0 since magnets are not rotated, ΔLk,nuc = 0 since no nucleosomes are formed yet and ΔLk,DNA = 0 by definition at the peak of the rotation curve. At point c, the maximum of the rotation curve after assembly, ΔLk = −8 since the magnets are rotated 8 turns to bring the construct to the peak in the rotation curve where ΔLk,DNA = 0 by definition, and therefore ΔLk,nuc = −8 since the overall linking number is conserved. At point b thus ΔLk = 0 since the magnets are not rotated, ΔLk,nuc = −8 after nucleosome assembly and ΔLk,DNA = 8 since the overall linking number is conserved. The change in linking number ΔLk,nuc due to nucleosome formation can thus be measured by measuring the number of the turns by which the maximum of the rotation curve is shifted to the left. The decrease in end-to-end length during assembly is caused by nucleosome assembly (see Figure 1C) as well as by the change in supercoiling state. The end-to-end length change introduced by nucleosome assembly can be independently read off from the difference in height of the peak of the rotation curve.
Figure 5
Figure 5. The difference in end-to-end length of the peak of the rotation curves before and after the assembly experiment, plotted against the change in supercoiling state as deduced from the shift of the maximum of the rotation curve (ΔLk,nuc).
Black squares show the results for experiments of NAP1 preincubated with all four histones assembled at 0.3 pN, grey triangles at 1 pN. Blue stars are the results from experiment of NAP1 preincubated with histones H3 and H4 only. A linear fit through the origin of the black and grey data (red line) reveals a slope of 56±3 nm per turn (red line). If one assumes that the assembly of one nucleosome results in the formation of 1 positive supercoil, this means that the assembly of one nucleosome decreases the end-to-end length by 56 nm at 0.3 pN. For comparison, lines with a slope of 40 (black) and 80 (green) nm decrease per negative unit change in linking number ΔLk,nuc are shown. The experiments with H3 and H4 only do show a decrease in end-to-end length but do not show a change in linking number.
Figure 6
Figure 6. Force-induced disassembly of nucleosomes from DNA after assembly with NAP1.
A Upon increasing the force to 14 pN at time t = 0, the end-to-end length increases stepwise due to nucleosome unwrapping. Raw data are shown in black, the steps calculated by the step-finder software are shown in red. B Histogram of the force-induced disassembly steps of 5 molecules. Two Gaussian peaks are fitted to the histogram (and these two peaks in green add up to the total represented by the black line). The largest peak is observed at 24 nm (FWHM = 14 nm). A smaller second peak is seen at 7.5 nm (FWHM = 8 nm). C Rotation curves before (red squares) and after (blue circles) a NAP1-assisted nucleosome assembly experiment. After applying high pulling forces, a third rotation curves is measured (green triangles) that is close to that of the DNA before assembly of nucleosomes, showing that one can recover the nonsupercoiled state of the original bare DNA.

Similar articles

Cited by

References

    1. Kornberg RD (1977) Structure of chromatin. Ann Rev Biochem 46: 931–954. - PubMed
    1. Luger K, Mäder AW, Richmond RK, Sargent DF, Richmond TJ (1997) Crystal structure of the nucleosome core particle at 2.8 A resolution. Nature 389: 251–260. - PubMed
    1. Arents G, Burlingame RW, Wang BC, Love WE, Moudrianakis EN (1991) The nucleosomal core histone octamer at 3.1 A resolution: a tripartite protein assembly and a left-handed superhelix. Proceedings of the National Academy of Sciences of the United States of America 88: 10148–10152. - PMC - PubMed
    1. Daban JR, Cantor CR (1982) Role of histone pairs H2A,H2B and H3,H4 in the self-assembly of nucleosome core particles. Journal of molecular biology 156: 771–789. - PubMed
    1. Smith S, Stillman B (1991) Stepwise assembly of chromatin during DNA replication in vitro. The EMBO journal 10: 971–980. - PMC - PubMed

Publication types