

Myeloid cells obtained from the blood but not from the tumor can suppress T-cell proliferation in patients with melanoma
- PMID: 22837179
- PMCID: PMC6374773
- DOI: 10.1158/1078-0432.CCR-12-1108
Myeloid cells obtained from the blood but not from the tumor can suppress T-cell proliferation in patients with melanoma
Abstract
Purpose: Myeloid-derived suppressor cells (MDSC) have emerged as an immune-regulatory cell type that is expanded in tumor-bearing mice, but less is known about their immune-suppressive role in patients with cancer.
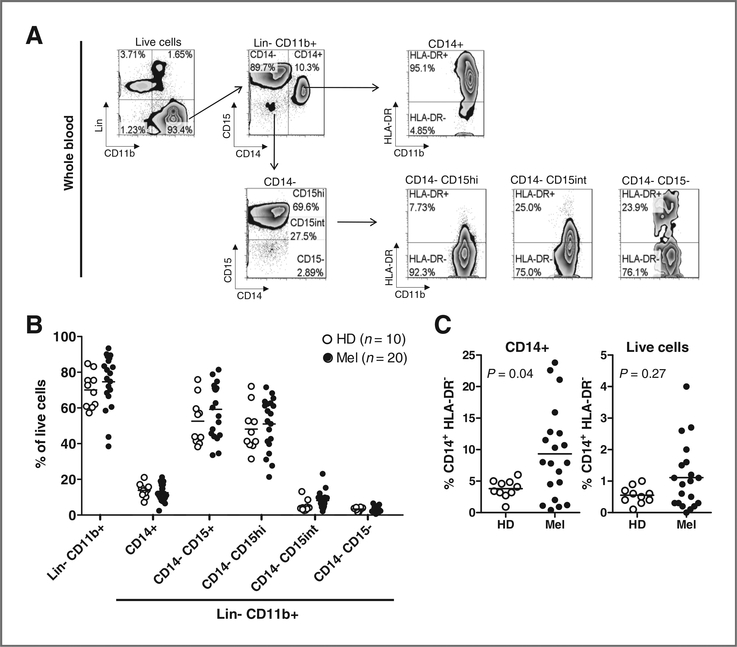
Experimental design: To study the importance of MDSC in patients with melanoma, we characterized the frequency, phenotype, and suppressive function of blood myeloid-derived cells and tumor-infiltrating myeloid cells in 26 freshly resected melanomas.
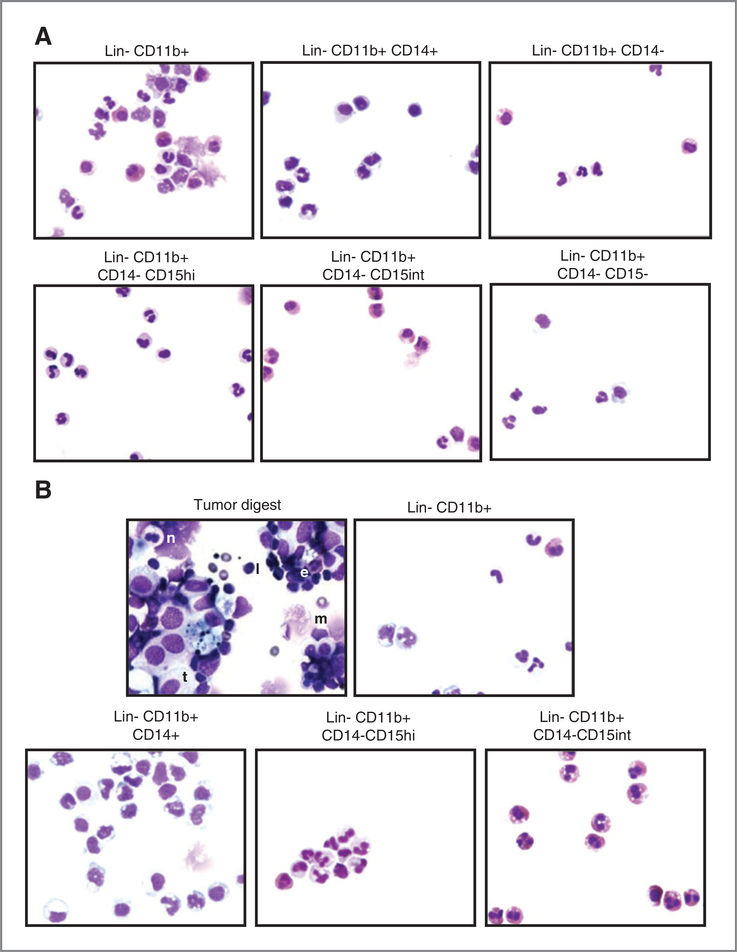
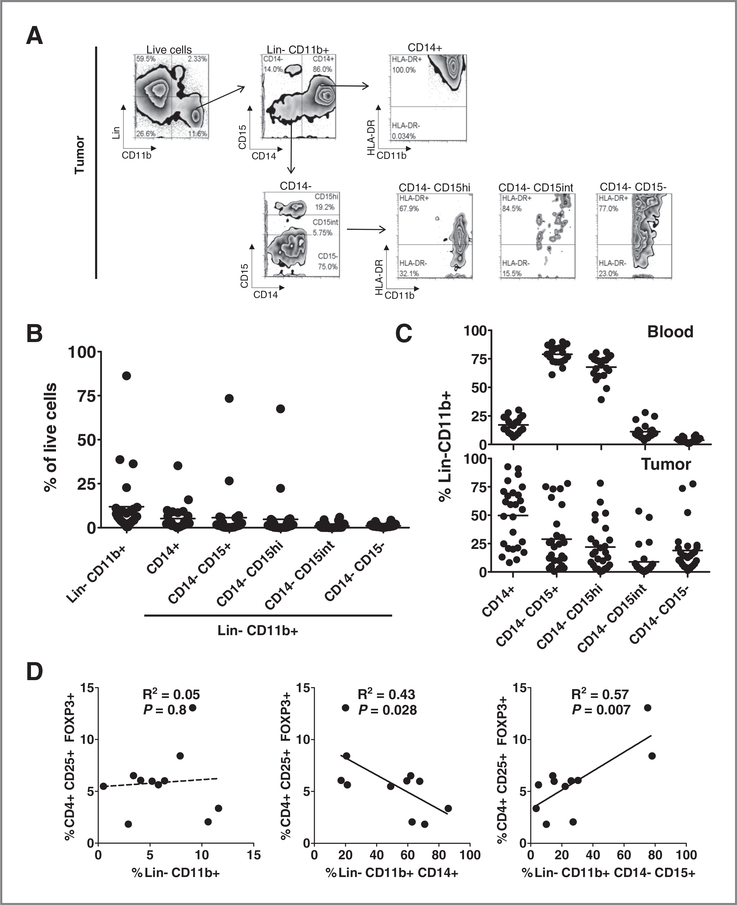
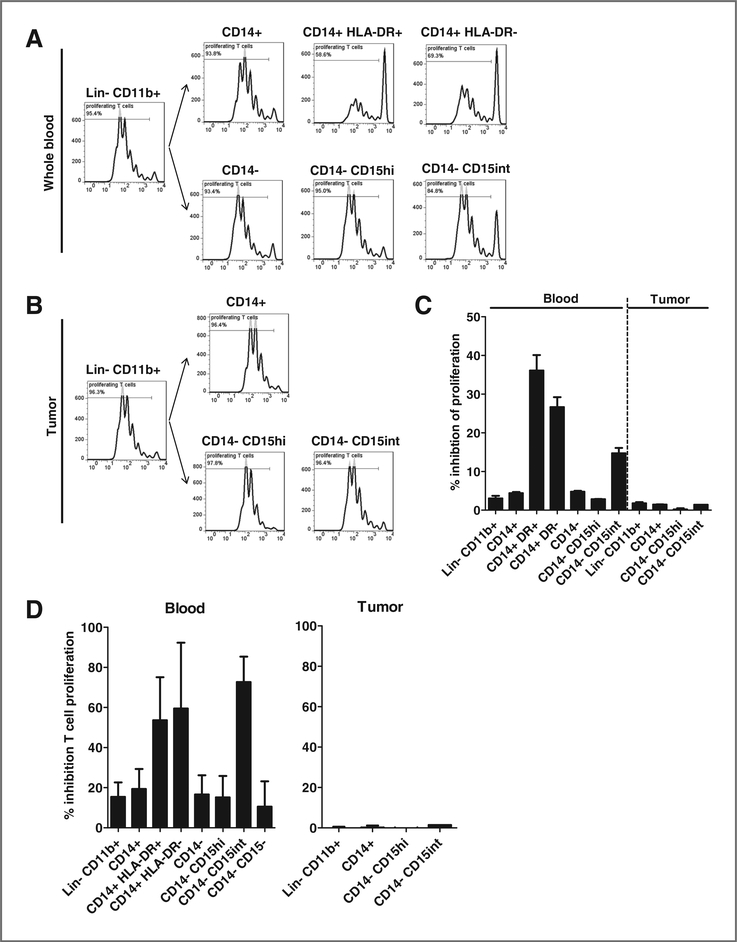
Results: Blood and tumor-infiltrating myeloid cells (Lin(-) CD11b(+)) could be phenotypically and morphologically classified into monocytes/macrophages, neutrophils, eosinophils, and immature myeloid cells according to marker expression (CD14(+), CD14(-) CD15(hi), CD14(-) CD15(int), and CD14(-) CD15(-), respectively). In contrast to the expansion of MDSC reported in tumor-bearing mice, we found no differences in the frequency and phenotype of myeloid subsets in the blood of patients with melanoma compared with healthy donors. Myeloid cells represented 12% of the live cells in the melanoma cell suspensions, and were phenotypically diverse with high tumor-to-tumor variability. Interestingly, a positive association was found between the percentage of Tregs and granulocytic cells (Lin(-) CD11b(+) CD14(-)CD15(+)) infiltrating melanoma tumors. However, melanoma-infiltrating myeloid cells displayed impaired suppression of nonspecific T-cell proliferation compared with peripheral blood myeloid cells, in which monocytes and eosinophils were suppressive.
Conclusions: Our findings provide a first characterization of the nature and suppressive function of the melanoma myeloid infiltrate and indicate that the suppressive function of MDSC in patients with melanoma seems far less than that based on murine tumor models.
Conflict of interest statement
Disclosure of Potential Conflicts of Interest
No potential conflicts of interest were disclosed by the authors.
Figures
Comment in
-
The power of negative thinking: which cells limit tumor immunity?Clin Cancer Res. 2012 Oct 1;18(19):5157-9. doi: 10.1158/1078-0432.CCR-12-2418. Epub 2012 Aug 21. Clin Cancer Res. 2012. PMID: 22912390
Similar articles
-
CD4+ T effector memory cell dysfunction is associated with the accumulation of granulocytic myeloid-derived suppressor cells in glioblastoma patients.Neuro Oncol. 2016 Jun;18(6):807-18. doi: 10.1093/neuonc/nov280. Epub 2015 Nov 17. Neuro Oncol. 2016. PMID: 26578623 Free PMC article.
-
Myeloid-derived suppressor cells are associated with disease progression and decreased overall survival in advanced-stage melanoma patients.Cancer Immunol Immunother. 2013 Nov;62(11):1711-22. doi: 10.1007/s00262-013-1475-x. Epub 2013 Sep 27. Cancer Immunol Immunother. 2013. PMID: 24072401 Free PMC article.
-
Melanoma-educated CD14+ cells acquire a myeloid-derived suppressor cell phenotype through COX-2-dependent mechanisms.Cancer Res. 2013 Jul 1;73(13):3877-87. doi: 10.1158/0008-5472.CAN-12-4115. Epub 2013 Apr 30. Cancer Res. 2013. PMID: 23633486
-
Increased frequencies of CD11b(+) CD33(+) CD14(+) HLA-DR(low) myeloid-derived suppressor cells are an early event in melanoma patients.Exp Dermatol. 2014 Mar;23(3):202-4. doi: 10.1111/exd.12336. Exp Dermatol. 2014. PMID: 24495013
-
Myeloid-derived suppressors cells (MDSC) correlate with clinicopathologic factors and pathologic complete response (pCR) in patients with urothelial carcinoma (UC) undergoing cystectomy.Urol Oncol. 2018 Sep;36(9):405-412. doi: 10.1016/j.urolonc.2018.02.018. Epub 2018 Mar 30. Urol Oncol. 2018. PMID: 29606341 Review.
Cited by
-
Inhibition of CSF-1 receptor improves the antitumor efficacy of adoptive cell transfer immunotherapy.Cancer Res. 2014 Jan 1;74(1):153-161. doi: 10.1158/0008-5472.CAN-13-1816. Epub 2013 Nov 18. Cancer Res. 2014. PMID: 24247719 Free PMC article.
-
Computational algorithm-driven evaluation of monocytic myeloid-derived suppressor cell frequency for prediction of clinical outcomes.Cancer Immunol Res. 2014 Aug;2(8):812-21. doi: 10.1158/2326-6066.CIR-14-0013. Epub 2014 May 20. Cancer Immunol Res. 2014. PMID: 24844912 Free PMC article. Clinical Trial.
-
Rethinking the role of myeloid-derived suppressor cells in adoptive T-cell therapy for cancer.Oncoimmunology. 2014 Apr 15;3:e28464. doi: 10.4161/onci.28464. eCollection 2014. Oncoimmunology. 2014. PMID: 25050213 Free PMC article.
-
Mobilization of monocytic myeloid-derived suppressor cells is regulated by PTH1R activation in bone marrow stromal cells.Bone Res. 2023 Apr 21;11(1):22. doi: 10.1038/s41413-023-00255-y. Bone Res. 2023. PMID: 37085481 Free PMC article.
-
A clinical and biological perspective of human myeloid-derived suppressor cells in cancer.Cell Mol Life Sci. 2016 Nov;73(21):4043-61. doi: 10.1007/s00018-016-2278-y. Epub 2016 May 28. Cell Mol Life Sci. 2016. PMID: 27236468 Free PMC article. Review.
References
-
- Dolcetti L, Peranzoni E, Ugel S, Marigo I, Fernandez Gomez A, Mesa C, et al. Hierarchy of immunosuppressive strength among myeloidderived suppressor cell subsets is determined by GM-CSF. Eur J Immunol 2010;40:22–35. - PubMed
Publication types
MeSH terms
Substances
Grants and funding
LinkOut - more resources
Full Text Sources
Other Literature Sources
Medical
Research Materials
