Review
. 2012 Jun;76(2):159-216.
doi: 10.1128/MMBR.05023-11.

Viral quasispecies evolution

Affiliations
Review

Viral quasispecies evolution

Esteban Domingo et al. Microbiol Mol Biol Rev. 2012 Jun.

Abstract

Evolution of RNA viruses occurs through disequilibria of collections of closely related mutant spectra or mutant clouds termed viral quasispecies. Here we review the origin of the quasispecies concept and some biological implications of quasispecies dynamics. Two main aspects are addressed: (i) mutant clouds as reservoirs of phenotypic variants for virus adaptability and (ii) the internal interactions that are established within mutant spectra that render a virus ensemble the unit of selection. The understanding of viruses as quasispecies has led to new antiviral designs, such as lethal mutagenesis, whose aim is to drive viruses toward low fitness values with limited chances of fitness recovery. The impact of quasispecies for three salient human pathogens, human immunodeficiency virus and the hepatitis B and C viruses, is reviewed, with emphasis on antiviral treatment strategies. Finally, extensions of quasispecies to nonviral systems are briefly mentioned to emphasize the broad applicability of quasispecies theory.


Figures

Fig 1
Fig 1
The two fundamental equations of quasispecies theory (243). The first equation describes the concentration of mutant i as a function of time, xi(t), and accordingly, xk(t) describes the concentration of mutant k. Ai, Di, and Wik are reaction rate parameters for the replication of i, for the degradation of i, and for the error-prone synthesis of i on k being the template, respectively. The factor Qi expresses the fraction of correct replications producing i through copying of template i. Φi is a function which describes the flux of molecules as a consequence of the embedding of the replication-mutation system in some environment. In a simple flow reactor, Φi would be proportional to the concentration of i. This equation describes the dynamics of mutant generation within mutant spectra, as represented schematically in Fig. 2, 3, and 5. Extensions of the original equation have been developed, as described in references quoted in the text. The second equation is the error threshold relationship, in which νmax is the maximum genetic complexity that can be maintained during replication, σ0 is the selectivity or superiority of the master sequence relative to the sequences of the mutant spectrum, and is the average copying fidelity of the replicative system, with 1 − being the average error rate per site and replication. The equation shows two important conditions: (i) the existence of a maximal sequence length νmax for constant replication accuracy (left side) and (ii) the existence of a maximal error rate for constant sequence length (right side). Exceeding the limiting values leads to a breakdown of inheritance. The second case is of particular importance in virology since a drug-induced increase of the mutation rate may drive a virus population beyond the error threshold. This lies at the basis of lethal mutagenesis, depicted schematically in Fig. 12 and discussed in the text.
Fig 2
Fig 2
Schematic representation of the evolution (change in composition) of a viral quasispecies without modification of the consensus sequence. Viral genomes are represented as horizontal lines and mutations as different colored symbols on the lines. Discontinuous lines indicate genomes that have acquired five or more mutations and that cannot survive to act as the template for the next generation of genomes (large arrows). Other genomes can incorporate mutations during replication (i.e., genome 2 in the distribution on the left generates genomes 2 and 3 in the second distribution, until an excess of mutations in genome 2 of the third distribution impedes its replication). Thus, a constant evolution in the mutant spectrum can nevertheless yield the same consensus sequence, depicted as a line devoid of mutations at the bottom. In a viral population the number of genomes in a single replicative unit in an infected cell can reach several thousand rather than 27, implying a highly dynamic and indeterminate mutant spectrum or cloud, as discussed in the text.
Fig 3
Fig 3
The selective advantage (relative fitness) of a mutant genome (with its associated cloud) alters the rate of dominance in a population. Mutant spectra are depicted as in Fig. 2, with mutations on genomes indicated as colored symbols on the lines. In the upper mutant distribution, the mutation highlighted by a black asterisk in genome 8 of the first distribution confers a selective advantage that results in dominance of that mutation after a given number of replication rounds (several large arrows, but only two are drawn). The selective advantage results in the dominance of genomes with the mutation in the mutant spectrum (upper right distribution) and modification of the consensus sequence (below the upper right distribution). In the bottom mutant distribution, the same mutation in genome 8 confers a modest selective advantage, and despite its frequency increasing in the population, it does not become dominant (bottom right distribution) and the consensus sequence remains invariant (below the bottom right distribution). The mutations that accompanied the relevant one in the initial genome need not be maintained after multiple rounds of copying. This scheme illustrates that fitness gain may not be reflected in a modification of the consensus sequence and, consequently, that selective events can be overlooked if mutant spectra are not analyzed, as discussed in the text.
Fig 4
Fig 4
Simplified representation of several types of genetic modifications that can alter the composition of viral quasispecies. (A) Mutation is a universal class of genetic variation and the basis of the original quasispecies formulation, as described in the text. (B) Hypermutation (generally biased toward some mutation types) is a consequence of cellular editing activities acting on viral genomes. (C) Genome segment reassortment occurs in viruses with segmented genomes and is responsible for the antigenic shift associated with new influenza pandemics. (D) Recombination results in formation of mosaic genomes, either by template switching (replicative recombination [left]; the negative, complementary strand is depicted with darker color) or breakage and rejoining of RNA molecules (nonreplicative recombination [right]). (E) A high multiplicity of infection passages of FMDV resulted in genome segmentation, as described in “Fitness Gain and Genetic Change: Genome Segmentation” in the text (schemes are based on references , , and 306).
Fig 5
Fig 5
A quasispecies distribution (represented as in Fig. 2 and 3, with each genome identified with a letter) may hide distinguishable virus subpopulations. Partition analysis of quasispecies (PAQ) is a nonhierarchical bioinformatics procedure that groups components of viral quasispecies (39, 40). In this example we depict mutant classes as spheres of sizes proportional to the number of genomes in each class.
Fig 6
Fig 6
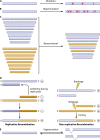
Fitness evolution of RNA virus populations. Mutant distributions are represented as horizontal lines and colored symbols as in Fig. 2 and 3. Large population passages in a constant environment generally result in a fitness increase (bottom trapezoid), which may or may not result in a modification of the consensus sequence (lines below the distribution). In contrast, plaque-to-plaque transfers (discontinuous genome in the central mutant distribution and discontinuous arrow) result in an accumulation of mutations, also reflected in the consensus sequence, and fitness decline. Plaque-to-plaque transfers decrease the complexity of mutant spectra and mimic bottleneck events that occur during virus life cycles, as discussed in the text.
Fig 7
Fig 7
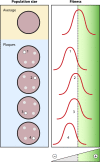
Population size may affect the evolutionary outcome. The large rectangle represents a viral quasispecies. Each symbol (even of the same shape and color) portrays a slightly different sequence. Three types of particles harboring mutations that can confer resistance to a selective agent are distinguished (red triangles, white squares, and yellow stars) from other components of the mutant spectrum (blue circles). If a small population is analyzed (white inner circle on the left), no resistant variants will be found. Further viral replication of that subpopulation will be needed to generate the resistant mutants. If an intermediate-size population is analyzed (intermediate gray inner circle on the right), two of the resistant variants will be found. If a large population is analyzed (large circle), all relevant variants will be represented. This scheme illustrates how the viral population size can condition the results of intrahost or interhost virus transmission, or of experimental evolution, in relation to drug resistance or other phenotypic traits (see text).
Fig 8
Fig 8
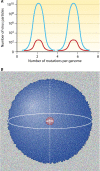
Relevance of the complexity and size of the mutant spectrum in RNA virus evolution. (A) Diagram of four virus populations of different sizes and complexities. The blue and red curves represent populations that differ greatly in size (ordinate). Populations on the right contain a larger average number of mutations per genome than those on the left (abscissa). A large population size and high numbers of mutations favor adaptation unless interfering interactions or the threshold for virus viability intervenes. With an average number of about 5 mutations per genome, a population of 2 × 10¹¹ virus particles includes 3.3 × 10⁹ single mutants and 2.6 × 10³ genomes with 20 mutations (calculation based on the Poisson distribution, ignoring fitness effects of mutations). A population of 1 × 10⁸ particles includes 3.3 × 10⁶ single mutants and only 26 genomes with 20 mutations. (B) An imaginary representation in only three dimensions of a different occupation of sequence space. In the background of a huge theoretical multidimensional sequence space (square) (see text), viruses occupy a tiny minority that may require expansion to neighbor points in an adaptation process. The two spheres with a 10-fold difference in radius represent two viral populations that differ in sequence space occupancy. In this drastic simplification to three dimensions, viruses in the large sphere have a 100-fold-larger number of potential direct contacts in neighboring, unoccupied positions of sequence space than viruses in the small sphere (based on the sphere surface). Such neighboring positions can be reached by a limited number of mutational steps. Several examples of adaptability mediated by an increase of mutation rate or population size are described in different sections of the text.
Fig 9
Fig 9
Early evidence of complementation within a viral quasispecies. The average fitness of an uncloned population is higher than the fitness of viral populations grown from individual viral plaques 1, 2, 3, and 4 (215, 224) (fitness values are depicted as a triangle at the bottom).
Fig 10
Fig 10
A schematic representation of interactions of complementation and interference (or defection) within mutant spectra. Standard genomes are depicted as smooth blue spheres and interfering genomes as rough red spheres. Each symbol (even of the same shape) portrays a slightly different genomic sequence. Complementing interactions (thin arrows, left side) dominate when an RNA virus replicates with standard mutation rates. Under such conditions, the fitness of the population ensemble is higher than that of the individuals that compose the population. When mutation rates increase, interfering interactions (thick arrows, right side) dominate and viable individuals are more fit than the ensemble. (Adapted from reference .)
Fig 11
Fig 11
Modification of the repertoire of antibody escape mutants of a virus associated with dispensability of a host receptor for infectivity. The picornavirus FMDV genome (displayed at the top) includes a major antigenic determinant (amino acid sequence written with the single-letter code), with an epitope recognized by neutralizing antibody SD6 (underlined sequence) which includes the sequence RGDL (boxed) also involved in recognition of integrin receptors. FMDV C-S8c1 SD6 escape mutations map around but not within the RGDL (top gray box). Subscripts indicate the number of times that a given escape mutant was obtained in independent selection events. The repertoire of SD6 escape mutants of FMDV C-S8c1 passaged 100 times in cell culture (C-S8c1p100) expanded to include substitutions at residues G142, D143, and L144 (bottom gray box). The expansion of the escape mutant repertoire was due to integrin receptors being dispensable for the multiply passaged FMDV. (Adapted from reference with permission.)
Fig 12
Fig 12
Schematic representation of our present assessment of the events involved in virus extinction by increased mutagenesis. The picture is based on the concept of error threshold of quasispecies theory (Fig. 1), modified by experimental findings with RNA viruses. The error threshold is depicted here as a region of template-copying fidelity where the transition from a quasispecies distribution to random sequences (loss of information) occurs. Before entering the threshold domain, at least two transitions occur: lethal defection followed by overt lethality. Interference and lethal mutations drive viral populations toward extinction, while selection of mutations that confer resistance to the mutagenic agent used preserves quasispecies identity. See the text for experimental evidence and references.
Fig 13
Fig 13
Schematic representation of interference exerted by a trans-acting viral protein. (A) A viral genome and two mutants (with tan, blue, and red genomic regions) encode a wild-type (tan, functional) and two mutant (blue and red, increasingly defective and interfering, respectively) proteins as a consequence of mutagenesis acting on a viral genome. (B) The relevant protein acts as a hexamer in the virus life cycle. An increasing proportion of mutant proteins will accentuate interference (defection) by decreasing the activity of the protein. It is worth noting that the same mutant protein can act to interfere or to complement, depending on the biological context. A blue protein may rescue some activity when the red protein is dominant but may decrease activity when the wild-type (tan) protein is dominant. This is one of the mechanisms postulated to modulate viral fitness in mutagenized populations (compare with Fig. 10; see text for references).
Fig 14
Fig 14
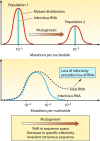
Effect of increased mutagenesis in a viral population. In the top panel, mutagenesis increases 100-fold the average mutation frequency of a mutant spectrum, resulting in a decrease of the amount of infectious RNA. The second panel indicates that high mutation frequencies result in a decrease of the proportion of infectious viral RNA in a population, with loss of infectivity preceding loss of viral RNA replication. The bottom box stresses three major events associated with enhanced mutagenesis, as discussed in the text.
Fig 15
Fig 15
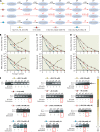
A sequential administration of first an inhibitor and then a mutagenic agent can be more effective than the corresponding combination of drugs. In this model experiment with FMDV in cell culture, guanidine hydrochloride (GU) was used as the inhibitor and ribavirin (R) as the mutagen. (A) Scheme of four drug administration protocols involving five virus passages in BHK-21 cells: only GU, only R, a combination of GU and R (GU+R), or first one passage with GU and then four passages with R (GU, +R). (B, C, and D) Virus titer and viral RNA molecules at different passages as a function of treatment regimen and drug concentrations (given in the box above the panels and below the abscissas). Note that the lowest titers and viral RNA levels are attained with the sequential protocols. (E) Reverse transcription-PCR (RT-PCR) amplifications used to detect viral RNA in the corresponding cell culture supernatants to monitor viral extinction. The upper part of each panel identifies the drug treatment and passage number. + or − below the panels indicates positive or negative RT-PCR amplification and extinction. M, molecular size markers; C+ and C−, positive and negative controls, respectively. Note the earlier extinction with sequential treatment at the two highest GU concentrations. (Adapted from reference , in which experimental details are described.)
Fig 16
Fig 16
Interconnected parameters that contribute to disease progression. Replication rate is directly related to the viral load. Viral load, together with population genetic heterogeneity, permits exploration of sequence space for fitness increase. One of the elements of viral pathogenesis is cellular perturbation by virus that displays effective interactions with cells, tissues, and organs, which is increasingly likely when the virus is enriched in potentially functional mutants. Therefore, a major aim of therapy is to oppose increases of viral load or viral fitness. See the text for experimental evidence and exceptions.
None
None
None

Similar articles

Cited by

References

    1. Aaskov J, Buzacott K, Thu HM, Lowry K, Holmes EC. 2006. Long-term transmission of defective RNA viruses in humans and Aedes mosquitoes. Science 311:236–238 - PubMed
    1. Acharya R, et al. 1989. The three-dimensional structure of foot-and-mouth disease virus at 2.9 Å resolution. Nature 337:709–716 - PubMed
    1. Aebischer T, Moskophidis D, Rohrer UH, Zinkernagel RM, Hengartner H. 1991. In vitro selection of lymphocytic choriomeningitis virus escape mutants by cytotoxic T lymphocytes. Proc. Natl. Acad. Sci. U. S. A. 88:11047–11051 - PMC - PubMed
    1. Agol VI. 2006. Molecular mechanisms of poliovirus variation and evolution. Curr. Top. Microbiol. Immunol. 299:211–259 - PubMed
    1. Agol VI. 2010. Picornaviruses as a model for studying the nature of RNA recombination, p 239–252 In Ehrenfeld E, Domingo E, Roos RP. (ed), The Picornaviruses. ASM Press, Washington, DC

Publication types