. 2012 May 8;109(19):E1163-72.
doi: 10.1073/pnas.1119592109. Epub 2012 Apr 16.

Kaposi's sarcoma-associated herpesvirus interacts with EphrinA2 receptor to amplify signaling essential for productive infection

Affiliations

Kaposi's sarcoma-associated herpesvirus interacts with EphrinA2 receptor to amplify signaling essential for productive infection

Sayan Chakraborty et al. Proc Natl Acad Sci U S A. .

Abstract

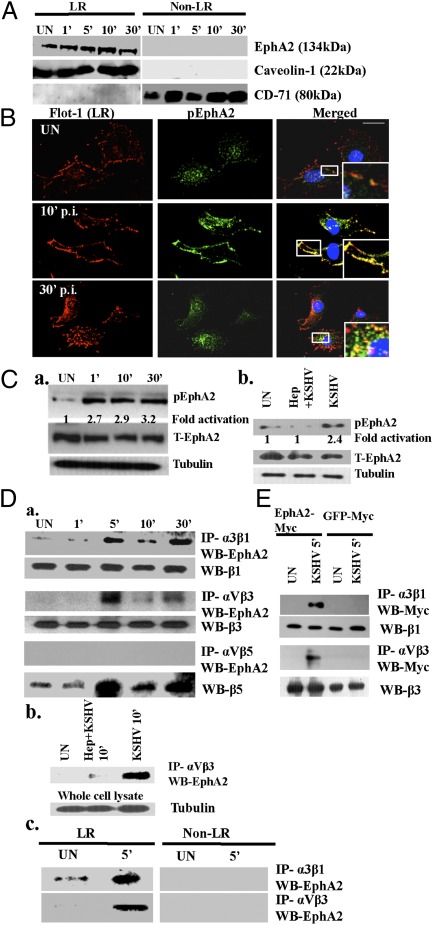
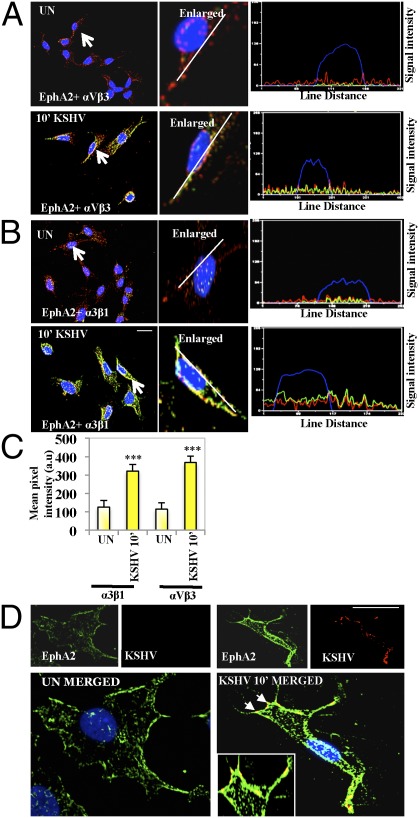
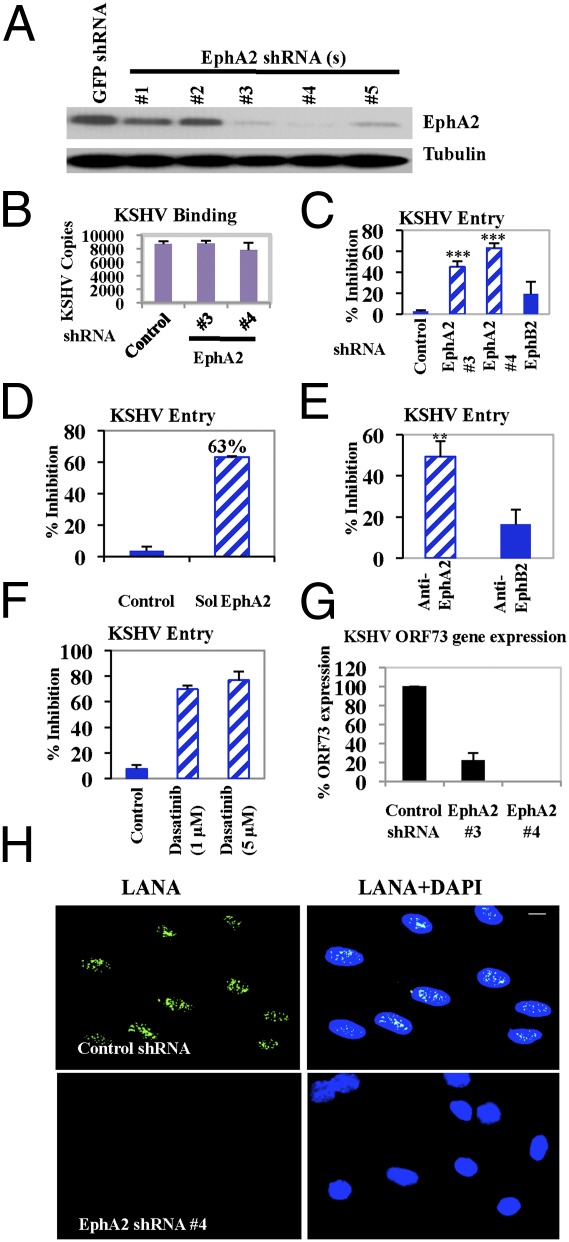
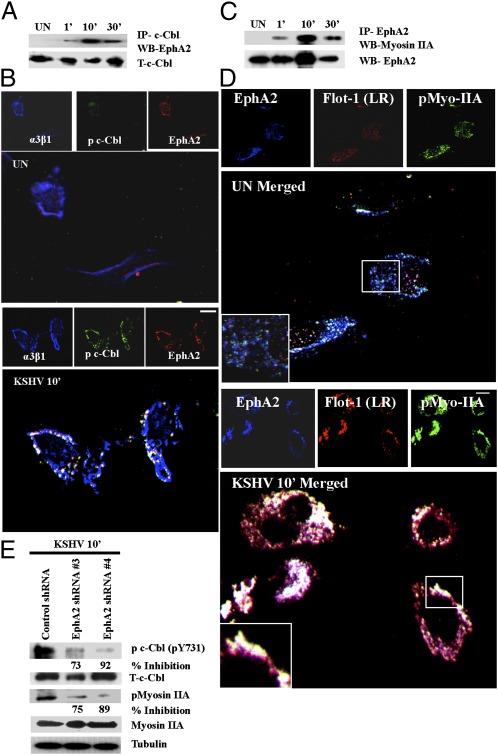
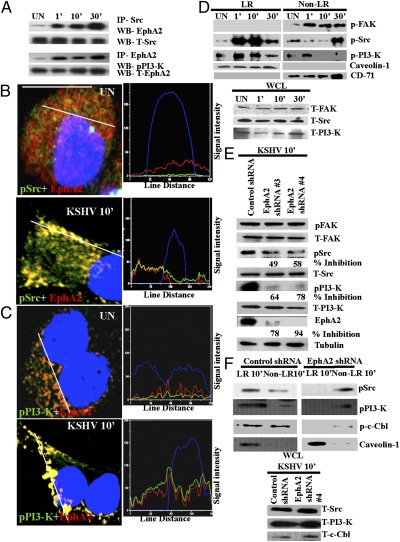
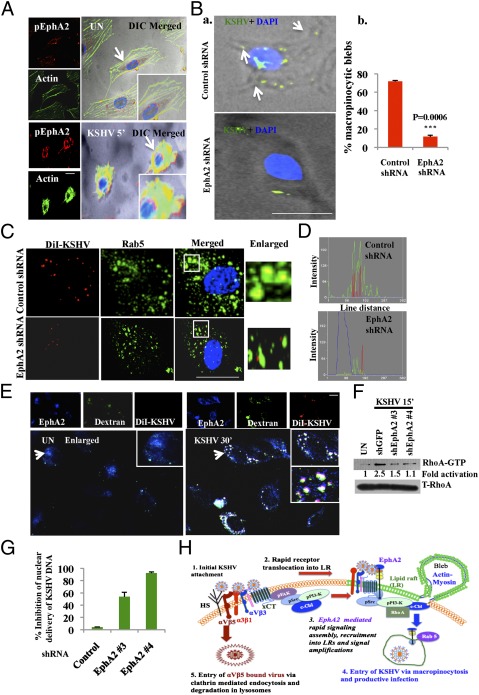
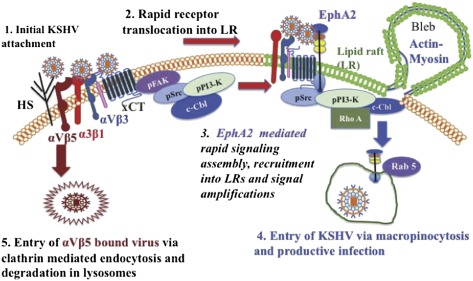
Kaposi's sarcoma-associated herpesvirus (KSHV), etiologically associated with Kaposi's sarcoma, uses integrins (α3β1, αVβ3, and αVβ5) and associated signaling to enter human dermal microvascular endothelial cells (HMVEC-d), an in vivo target of infection. KSHV infection activated c-Cbl, which induced the selective translocation of KSHV into lipid rafts (LRs) along with the α3β1, αVβ3, and xCT receptors, but not αVβ5. LR-translocated receptors were monoubiquitinated, leading to productive macropinocytic entry, whereas non-LR-associated αVβ5 was polyubiquitinated, leading to clathrin-mediated entry that was targeted to lysosomes. Because the molecule(s) that integrate signal pathways and productive KSHV macropinocytosis were unknown, we immunoprecipitated KSHV-infected LR fractions with anti-α3β1 antibodies and analyzed them by mass spectrometry. The tyrosine kinase EphrinA2 (EphA2), implicated in many cancers, was identified in this analysis. EphA2 was activated by KSHV. EphA2 was also associated with KSHV and integrins (α3β1 and αVβ3) in LRs early during infection. Preincubation of virus with soluble EphA2, knockdown of EphA2 by shRNAs, or pretreatment of cells with anti-EphA2 monoclonal antibodies or tyrosine kinase inhibitor dasatinib significantly reduced KSHV entry and gene expression. EphA2 associates with c-Cbl-myosin IIA and augmented KSHV-induced Src and PI3-K signals in LRs, leading to bleb formation and macropinocytosis of KSHV. EphA2 shRNA ablated macropinocytosis-associated signaling events, virus internalization, and productive nuclear trafficking of KSHV DNA. Taken together, these studies demonstrate that the EphA2 receptor acts as a master assembly regulator of KSHV-induced signal molecules and KSHV entry in endothelial cells and suggest that the EphA2 receptor is an attractive target for controlling KSHV infection.


Conflict of interest statement

The authors declare no conflict of interest.

Figures

Fig. 1.
Fig. 1.
Identification of EphA2 as an integrin-interacting molecule early during KSHV infection. (A) Serum-starved HMVEC-d cells were either mock or KSHV (10 DNA copies per cell) infected at the indicated time points. LR and non-LR fractions were isolated and analyzed for EphA2 by Western blot. Caveolin-1 and CD71 characterize the purity of LR and non-LR fractions, respectively. (B) Serum-starved HMVEC-d cells were either mock or KSHV infected at the indicated time points, washed, and reacted with anti-Flot-1 (LR marker) and pEphA2 antibodies, followed by Alexa 594 and 488 secondary antibodies, respectively. Representative immunofluorescence images are shown. Insets show the enlarged images of the boxed areas. (Scale bar: 10 μm.) (C, a and b) Serum-starved HMVEC-d cells were either uninfected or infected with KSHV or KSHV preincubated with 100 μg heparin for 1 h at 37 °C, for the indicated time points, and subjected to Western blot analysis for phospho-EphA2 (pEphA2). The blot was then stripped and reprobed for total EphA2 and tubulin as a loading control. (D) (a) Serum-starved HMVEC-d cells were either left uninfected or infected with KSHV for the indicated time points and immunoprecipitated with anti-α3β1, -αVβ3, or -αVβ5 antibodies and analyzed for EphA2 by Western blot. The blots were stripped and reprobed for total β1, β3, and β5, respectively. (b) Serum-starved HMVEC-d cells were either left uninfected or infected with heparin-treated KSHV for 10 min, immunoprecipitated with anti-αVβ3, and then Western blotted for EphA2. As loading controls, 10 μg whole-cell lysate protein was analyzed for tubulin by Western blot. (c) A total of 150 μg of LR and non-LR fractions from uninfected and KSHV-infected cells was immunoprecipitated with anti-αVβ3 or -α3β1 antibodies for 2 h at 4 °C and analyzed by Western blots for EphA2. (E) HEK293T cells were transfected with either EphA2-Myc or GFP-Myc plasmids. Forty-eight hours posttransfection, cells were either mock or KSHV infected (10 DNA copies per cell) and immunoprecipitated with anti-α3β1 and -αVβ3 antibodies. The immunoprecipitates were analyzed by Western blot for Myc. They were stripped and reprobed for total β1 and β3, respectively.
Fig. 2.
Fig. 2.
Colocalization of EphA2 with integrins and KSHV during infection. (A and B) Serum-starved (8 h) HMVEC-d cells were either left uninfected or infected for 10 min with KSHV (10 DNA copies per cell), washed, and processed for immunofluorescence using rabbit anti-EphA2 and mouse anti-α3β1 or -αVβ3 antibodies for 1 h at 37 °C. Subsequently, cells were stained with either anti-rabbit Alexa fluor 594 or anti-mouse Alexa fluor 488. Arrows indicate the enlarged cell. The line-scan signal intensity analysis of the cell shown in the enlarged images on the Right is depicted in the Bottom Right. (C) Colocalization mean pixel intensity plot (in arbitrary units) between integrins and EphA2 at 10 min p.i. (***P = 0.00016). (D) Serum-starved (8 h) HMVEC-d cells were either left uninfected (UN) or infected for 10 min with KSHV (10 DNA copies per cell), washed, and processed for immunofluorescence, using mouse anti-gpK8.1A and rabbit anti-EphA2 antibodies followed by anti-mouse Alexa fluor 488 or anti-rabbit Alexa fluor 594. Representative deconvoluted images are shown. The arrows represent colocalization, which is also shown in the Inset as the enlarged image. (Scale bar: 10 μm.)
Fig. 3.
Fig. 3.
Effect of EphA2 shRNA on KSHV entry and infection. (A) HMVEC-d cells were transduced with sh-GFP (control) or different sh-EphA2–expressing lentiviral vectors for 1 d. Cells cultured for 2 d were harvested and analyzed by Western blot for EphA2. (B and C) Control, EphA2 shRNA(s)-, or EphB2 shRNA-transduced HMVEC-d cells were infected with KSHV for 1 h at 4 °C (B) or 37 °C (C). After washing, total DNA was isolated and KSHV binding and entry were determined by real-time DNA PCR for the ORF73 gene. Each reaction was done in triplicate and each bar represents the average ± SD of three independent experiments. For B, results are presented as KSHV DNA copies bound to sh-EphA2–transduced and –untransduced cells. For C, results are presented as percentage of inhibition of KSHV DNA internalization by sh-EphA2 or EphB2 compared with untransduced cells incubated with the virus alone. (***P = 0.0001). (D) Untreated KSHV or KSHV preincubated with soluble EphA2 (Sol-EphA2) for 1 h at 37 °C was used to infect HMVEC-d cells for 1 h at 37 °C. Postwashing, KSHV entry was determined as described above. Each reaction was done in triplicate and each bar represents the average ± SD of three experiments. Data are presented as percentage of inhibition of KSHV DNA internalization by Sol-EphA2 compared with cells incubated with the virus alone. (E) HMVEC-d cells were treated with 10 μg/mL rabbit IgG, rabbit anti-EphA2, or anti-EphB2 antibodies for 1 h at 4 °C. After washing, cells were infected for 1 h at 37 °C and KSHV entry was determined as described previously. Data are represented as percentage of inhibition by Eph antibodies compared with IgG control. (**P = 0.005). (F) HMVEC-d cells were either left untreated or pretreated with solvent control or the indicated concentrations of dasatinib for 1 h at 37 °C. Cells were washed and infected with KSHV for 1 h at 37 °C and entry was determined. Data are represented as percentage of inhibition of KSHV DNA internalization compared with untreated cells. (G) Control or EphA2 shRNA-transduced HMVEC-d cells were infected with KSHV. At 24 h p.i., cells were harvested, total RNA was isolated, and viral gene expression was determined by real-time RT-PCR with KSHV ORF73 gene-specific primers. (H) Control or EphA2 shRNA (4)-transduced HMVEC-d cells were mock or KSHV (10 DNA copies per cell) infected for 2 h at 37 °C, washed, and cultured in complete media for another 46 h. After washing, cells were fixed and processed for immunofluorescence, using rabbit anti-LANA antibody. Representative images are shown. (Scale bar: 10 μm.)
Fig. 4.
Fig. 4.
KSHV-recruited EphA2 induced the formation of a c-Cbl, integrin, and myosin internalization complex. (A) Serum-starved HMVEC-d cells were either left uninfected or KSHV infected for the indicated time points and immunoprecipitated with anti–c-Cbl antibody and analyzed for EphA2 by Western blot. (B) Serum-starved (8 h) HMVEC-d cells were either left uninfected (UN) or infected for 10 min with KSHV (10 DNA copies per cell), washed, and processed for immunofluorescence assay using goat anti-EphA2, mouse anti-α3β1, and rabbit anti–c-Cbl antibodies for 1 h at 37 °C. Subsequently, cells were stained with anti-mouse Alexa fluor 405, anti-goat Alexa fluor 594, and anti-rabbit Alexa fluor 488, respectively. Representative 2D deconvoluted images are shown. (Scale bar: 10 μm.) (C) Serum-starved HMVEC-d cells were either uninfected or KSHV infected for the indicated time points, immunoprecipitated with EphA2 antibody, and Western blotted for myosin IIA. The blot was stripped and reprobed for EphA2. (D) Serum-starved uninfected (UN) or KSHV-infected HMVEC-d cells were processed as in C and immunostained for EphA2, p-myosin IIA, and LR marker (Flotillin-1). Representative images are shown. The boxed region in the merged panel is enlarged and shown in the Inset. (Scale bar: 10 μm.) (E) Control or EphA2 shRNA-transduced HMVEC-d cells were subjected to Western blot analysis for the indicated phosphorylated (activated) signal molecules. The blots were stripped and reprobed for the respective total c-Cbl and myosin IIA with tubulin as a loading control. The levels of inhibition are indicated.
Fig. 5.
Fig. 5.
EphA2 regulates the activation of KSHV-induced signal molecules during infection. (A) Serum-starved HMVEC-d cells were either left uninfected or KSHV infected for the indicated time points and immunoprecipitated with anti-Src or EphA2 antibodies and subjected to Western blot analyses for either EphA2 or pPI3-K. The blots were stripped and reprobed for the respective total proteins as indicated. (B and C) Serum-starved HMVEC-d cells were either mock or KSHV infected for 10 min. After washing, cells were processed for immunofluorescence microscopy using anti-pSrc (B) or pPI3-K (C) and EphA2 antibodies. They were subsequently stained with secondary antibodies conjugated with Alexa 488 or 594 and observed under an immunofluorescence microscope. Representative single-cell merged images with DAPI and line-scan signal intensity analysis are shown. (Scale bar: 10 μm). (D) One hundred fifty micrograms LR and non-LR fractions was analyzed by Western blots for phosphorylated signal molecules as indicated. Caveolin-1 and CD-71 are markers for LR and non-LR fractions, respectively. Twenty micrograms of whole-cell lysate (WCL) was subjected to Western blots for total protein levels. (E) Control or EphA2 shRNA-transduced HMVEC-d cells were subjected to Western blot analyses for the activated signal molecules (as indicated). The blots were stripped and reprobed for the respective total proteins and tubulin as a loading control. The levels of inhibition of activated signal molecules are indicated. (F) LR and non-LR fractions were isolated from control or EphA2 shRNA-transduced HMVEC-d cells infected with KSHV for 10 min. They were analyzed by Western blots for the indicated activated signal molecules. Caveolin-1 served as a marker for LR fractions. Twenty micrograms of WCL was subjected to Western blots for total protein levels.
Fig. 6.
Fig. 6.
EphA2 is required for productive endocytosis and trafficking of KSHV. (A) Serum-starved (8 h) HMVEC-d cells were either left uninfected or infected for 5 min with KSHV (10 DNA copies per cell), washed, and processed for immunofluorescence using rabbit anti-pEphA2 antibody, followed by anti-rabbit Alexa fluor 594 and phalloidin conjugated to Alexa 488. Representative DIC-merged images are shown. (Right) Arrows indicate EphA2 association with actin in the membrane ruffles. (B, a) Control and EphA2 shRNA-transduced HMVEC-d cells were infected with KSHV for 5 min and stained with anti-KSHV gpK8.1A monoclonal antibodies and DAPI. Representative DIC merged images are shown. Arrows indicate the regions of bleb formation in proximity to KSHV (green). (Scale bar: 10μm.) (B, b) Quantification of membrane blebs. The P value was calculated using a two-tailed Student’s t test. (C) Serum-starved control or EphA2 shRNA-4–transduced HMVEC-d cells were infected with DiI-KSHV for 5 min, washed, and processed for immunofluorescence using Rab5 antibody. Boxed areas are enlarged and represented in the Inset. (Scale bar: 10 μm.) (D) Representation of line-scan signal intensity plots performed on the enlarged cell shown in C. (E) HMVEC-d cells were incubated with media containing FITC-Dextran with or without DiI-KSHV for 30 min at 37 °C. Cells were fixed and processed for immunofluorescence, using anti-EphA2 antibody followed by secondary antibody conjugated with Alexa 405. (Scale bar: 10 μm.) Arrows indicate the boxed areas that are enlarged and represented in the Inset. (F) Serum-starved HMVEC-d cells were infected with KSHV for 15 min. Cells were washed and RIPA lysates were collected. For RhoA activity analysis, 150 μg protein was incubated with Rhotekin RBD-GST beads for 2 h at 4 °C, followed by Western blot analysis for RhoA-GTP. The blot was stripped and blotted for total RhoA. (G) Control or EphA2 shRNA(s)-transduced HMVEC-d cells were infected with KSHV (10 DNA copies per cell) for 2 h. Postwashing, total DNA from nuclear extracts was prepared and normalized to 100 ng/5 μL. Real-time DNA-PCR for ORF73 was performed to detect viral DNA copies in the nucleus. Error bar represents mean ± SD of three experiments. (H) Model depicting the role of EphA2 in KSHV entry and infection: (1) KSHV’s binding and interaction with heparan sulfate and integrins (α3β1, αVβ3, αVβ5) and x-CT initially occurs in non-LR regions. (2) This interaction is followed by c-Cbl–mediated rapid translocation of KSHV along with selective integrins (α3β1, αVβ3) and x-CT receptors into LRs. (3) This translocation promotes the association of EphA2 with translocated KSHV and integrins in the LRs. EphA2 coordinates the formation of an active signaling complex between integrins, c-Cbl and myosin IIA, thereby inducing macropinocytic blebs. To promote the necessary signaling stimulation required for macropinocytosis, EphA2 amplifies KSHV-induced pSrc, pPI3-K signaling, and the c-Cbl–myosin complex in the LRs. (4) Together, such complex signaling events trigger bleb formation, macropinocytosis, and internalization of KSHV into early macropinosomes that leads to productive trafficking of KSHV to the nucleus. (5) Non-LR αVβ5 bound viruses do not associate with EphA2 and are targeted toward a clathrin-dependent noninfectious lysosomal route.
Fig. P1.
Fig. P1.
Schematic model depicting the mechanistic role of EphA2 during KSHV entry and infection of dermal endothelial cells. (1) Initial KSHV attachment and interactions with binding and entry receptors occur in nonlipid raft areas of plasma membranes. (2) This process is followed by a KSHV-activated c-Cbl–mediated rapid translocation of selective virus-bound receptors (α3β1, αVβ3, and xCT) within 1 min of infection that leads into the interaction of virus with EphA2 in lipid rafts (LRs). (3) In conjunction with integrins, c-Cbl, and myosin IIA, EphA2 amplifies KSHV-induced Src and PI3-K signaling in LRs to promote viral internalization. (4) Signaling events regulated by EphA2 promote bleb formation, macropinocytosis, delivery of viral DNA into the nucleus, and viral gene expression. (5) Non-LR–bound viruses do not associate with EphA2 and are targeted to a clathrin-dependent noninfectious route that ends up in lysosomes, the degradative apparatus of the cell.

Similar articles

Cited by

References

    1. Chang Y, et al. Identification of herpesvirus-like DNA sequences in AIDS-associated Kaposi’s sarcoma. Science. 1994;266:1865–1869. - PubMed
    1. Ganem D. Kaposi's sarcoma-associated herpesvirus. In: Knipe DM, et al., editors. Fields Virology. 5th Ed. Vol 2. Philadelphia: Lippincott Williams & Wilkins; 2007. pp. 2875–2888.
    1. Chandran B. Early events in Kaposi’s sarcoma-associated herpesvirus infection of target cells. J Virol. 2010;84:2188–2199. - PMC - PubMed
    1. Akula SM, Pramod NP, Wang FZ, Chandran B. Integrin alpha3beta1 (CD 49c/29) is a cellular receptor for Kaposi’s sarcoma-associated herpesvirus (KSHV/HHV-8) entry into the target cells. Cell. 2002;108:407–419. - PubMed
    1. Akula SM, et al. Kaposi’s sarcoma-associated herpesvirus (human herpesvirus 8) infection of human fibroblast cells occurs through endocytosis. J Virol. 2003;77:7978–7990. - PMC - PubMed

Publication types

MeSH terms

LinkOut - more resources