. 2012 Jun 1;287(23):19472-86.
doi: 10.1074/jbc.M112.345728. Epub 2012 Apr 11.

High motility of triple-negative breast cancer cells is due to repression of plakoglobin gene by metastasis modulator protein SLUG

Affiliations

High motility of triple-negative breast cancer cells is due to repression of plakoglobin gene by metastasis modulator protein SLUG

Charvann K Bailey et al. J Biol Chem. .

Abstract

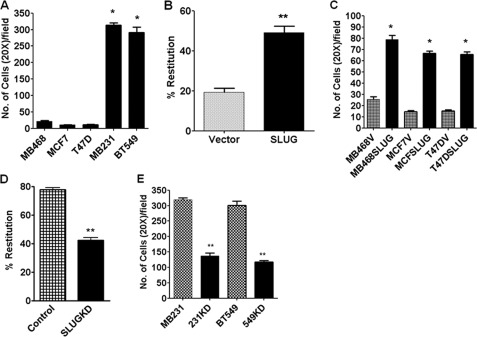
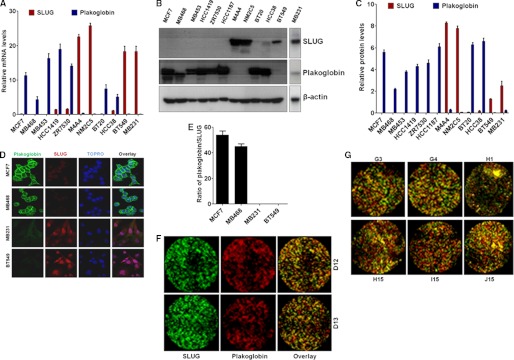
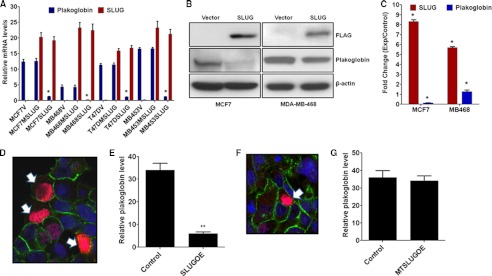
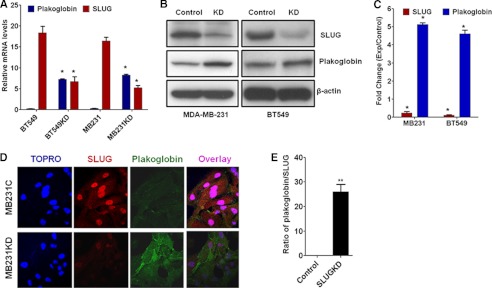
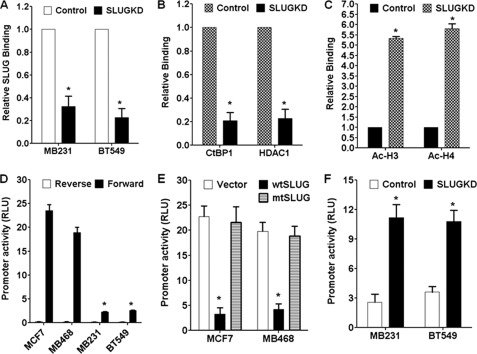
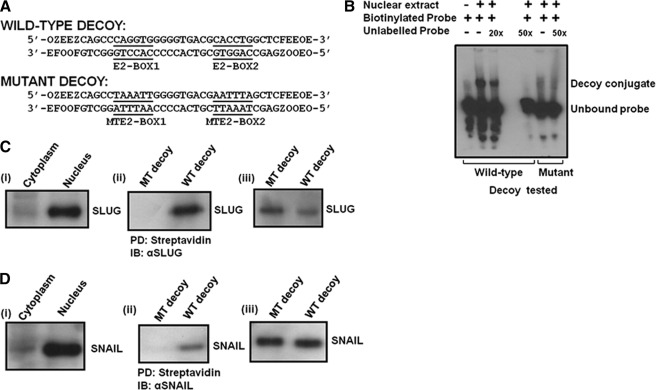
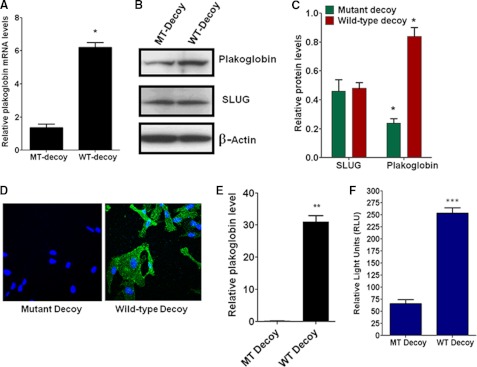
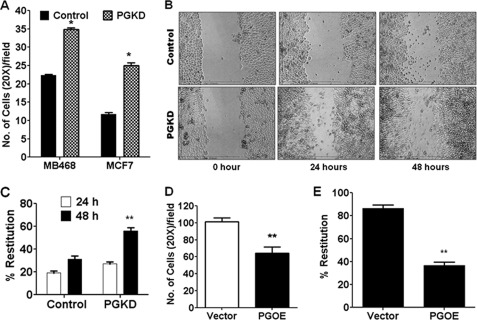
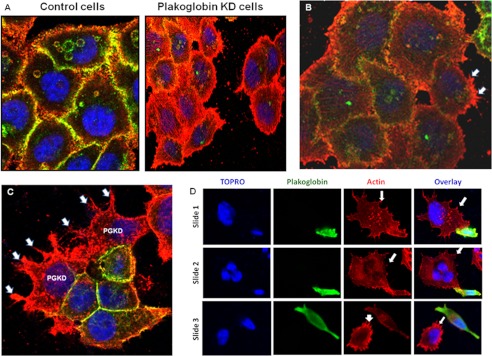
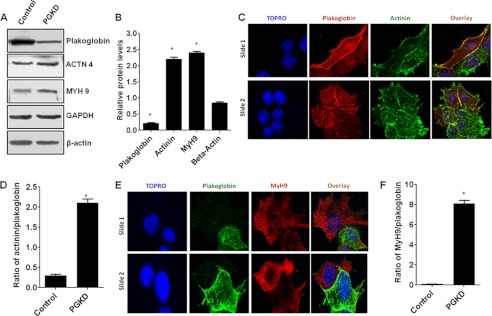
One of highly pathogenic breast cancer cell types are the triple negative (negative in the expression of estrogen, progesterone, and ERBB2 receptors) breast cancer cells. These cells are highly motile and metastatic and are characterized by high levels of the metastasis regulator protein SLUG. Using isogenic breast cancer cell systems we have shown here that high motility of these cells is directly correlated with the levels of the SLUG in these cells. Because epithelial/mesenchymal cell motility is known to be negatively regulated by the catenin protein plakoglobin, we postulated that the transcriptional repressor protein SLUG increases the motility of the aggressive breast cancer cells through the knockdown of the transcription of the plakoglobin gene. We found that SLUG inhibits the expression of plakoglobin gene directly in these cells. Overexpression of SLUG in the SLUG-deficient cancer cells significantly decreased the levels of mRNA and protein of plakoglobin. On the contrary, knockdown of SLUG in SLUG-high cancer cells elevated the levels of plakoglobin. Blocking of SLUG function with a double-stranded DNA decoy that competes with the E2-box binding of SLUG also increased the levels of plakoglobin mRNA, protein, and promoter activity in the SLUG-high triple negative breast cancer cells. Overexpression of SLUG in the SLUG-deficient cells elevated the motility of these cells. Knockdown of plakoglobin in these low motility non-invasive breast cancer cells rearranged the actin filaments and increased the motility of these cells. Forced expression of plakoglobin in SLUG-high cells had the reverse effects on cellular motility. This study thus implicates SLUG-induced repression of plakoglobin as a motility determinant in highly disseminating breast cancer.


Figures

FIGURE 1.
FIGURE 1.
SLUG level and in vitro motility are directly correlated in human breast cancer cells. A, shown is relative motility of different breast cancer cells as was determined by transwell assay. Results are the mean ± S.E. (n = 6). * indicates statistical significance p < 0.001. B, shown is evaluation of in vitro motility in the scratch assay of the control and the SLUG-expressing MDA-MB-468 cells. Results are the mean ± S.E. (n = 6). ** indicates statistical significance p < 0.01. C, shown is relative motility of human breast cancer cells ectopically expressing SLUG in the transwell migration assay. Results are the mean ± S.E. (n = 6). * indicates statistical significance p < 0.001. D, shown is evaluation of in vitro motility in the scratch assay of the control and the SLUG-knocked down MDA-MB-231 cells. Results are the mean ± S.E. (n = 6). ** indicates statistical significance, p < 0.01. E, shown is relative motility of human breast cancer cells with or without knockdown of SLUG in the transwell migration assay. Results are the mean ± S.E. (n = 6). ** indicates statistical significance, p < 0.01.
FIGURE 2.
FIGURE 2.
Inverse relationship in the levels of plakoglobin and SLUG in breast cancer cells and tissues. A, shown are relative levels of SLUG and plakoglobin mRNAs in different breast cancer cells as was determined by real-time RT-PCR analysis. β-Actin mRNA was used as a normalization control. Results are the mean ± S.E. (n = 6). B, shown is evaluation of the levels of SLUG and plakoglobin protein in different human breast cancer cells by immunoblotting. β-Actin was used as a loading control. C, shown is densitometric scanning of the Western blots to evaluate the relative levels of SLUG and plakoglobin in different breast cancer cells. Results are the mean ± S.E. (n = 4). D, immunofluorescence confocal microscopy shows the relative levels of SLUG (red) and plakoglobin (green) in four different human breast cancer cells. TOPRO was used to stain the nucleus. E, shown is a quantitative evaluation of the ratio of plakoglobin/SLUG in the immunofluorescence images as in D. F and G, immunofluorescence microscopic image shows distinct cells with high levels of SLUG (green) but no plakoglobin (red) and vice versa in human malignant breast cancer tissues. F, images show selected tissue microarray dots stained with SLUG (green), plakoglobin (red), and overlay. G, shown are examples of additional immunofluorescence images from the tissue microarray analysis. Refer to the supplemental Fig. S4 for the designations of the tissue dots and additional data.
FIGURE 3.
FIGURE 3.
Effect of ectopic expression of SLUG on the levels of plakoglobin in SLUG-negative breast cancer cells. A, shown is real-time RT-PCR analysis of the levels of SLUG and plakoglobin mRNAs in different SLUG-negative breast cancer cells transfected with empty vector (V), plasmid construct with mutated non-functional SLUG (MSLUG), or plasmid construct with wild-type functional SLUG (SLUG). Results are the mean ± S.E. (n = 6). * indicates statistical significance p < 0.001. B, shown is immunoblot analysis for SLUG and plakoglobin proteins in the control (vector-transfected) and SLUG-expressing (transfected with FLAG-SLUG construct) MCF7 and MDA-MB-468 cells. Recombinant SLUG protein was detected using FLAG antibody. β-Actin was used as a loading control. C, shown is a densitometric scan for SLUG and plakoglobin levels in six independent SLUG-transfected populations and the corresponding vector-transfected control cells. Results are the mean ± S.E. (n = 6). The * indicates that the -fold changes were statistically significant (p < 0.001). D, shown are immunofluorescence confocal microscopic analysis data showing down-regulation of plakoglobin in the MCF7 cells transfected with functional wild-type SLUG expressing plasmid. The cells were transiently transfected, and only those cells that have abundant expression of SLUG (red staining in the nucleus, shown by white arrows) lack plakoglobin on their cell membrane regions. Blue, TOPRO; green, plakoglobin; red, SLUG. E, quantitative evaluation of the relative levels of plakoglobin (with respect to TOPRO staining) in the immunofluorescence images was as in D. SLUG-overexpressing cells (SLUGOE) are those with a red stain in the nucleus. For adjacent cells with or without SLUG overexpression, only the boundaries of the cells not shared are quantitated. Results are the mean ± S.E. (n = 5). ** indicates statistical significance p < 0.01. F, immunofluorescence confocal microscopic analysis data show no detectable effect of non-functional mutated SLUG protein (red) on plakoglobin levels (green) in MCF7 cells transfected with mutated SLUG-expressing plasmid. The cell that expressed mutated SLUG is shown by a white arrow. G, quantitative evaluation of the relative levels of plakoglobin (with respect to TOPRO staining) in the immunofluorescence images was as in F. Results are the mean ± S.E. (n = 5). The changes between the control and the mutant SLUG-expressing (MTSLUGOE) cells were not statistically significant.
FIGURE 4.
FIGURE 4.
Effect of knockdown of SLUG on plakoglobin levels in MDA-MB-231 and BT549 cells. A, shown is quantitative RT-PCR analysis for SLUG and plakoglobin mRNA levels in MDA-MB-231 and BT549 cells treated with control or SLUG siRNAs. β-Actin mRNA was used as a normalization control. Results are the mean ± S.E. (n = 6). * indicates statistical significance p < 0.001. B, shown is an immunoblot analysis of plakoglobin levels in MDA-MB-231 and BT549 cells by with (KD) or without (Control) knocking down SLUG. Control cells were transfected with control siRNA. C, shown is evaluation of SLUG and plakoglobin protein levels in MDA-MB-231 and BT549 cells with or without knockdown of SLUG. Six independent SLUG-knocked down cell populations and corresponding control siRNA-treated cells were used. Results are the mean ± S.E. (n = 6). * indicates that the -fold changes observed were statistically significant (p < 0.001). D, immunofluorescence confocal microscopic analysis data show the effect of SLUG (red) knockdown on the level of plakoglobin (green) in MDA-MB-231 cells. TOPRO was used to stain the nuclei of the cells. E, shown is a quantitative evaluation of the ratio of plakoglobin/SLUG in the immunofluorescence images as in D. Results are the mean ± S.E. (n = 10). ** indicates statistical significance p < 0.01.
FIGURE 5.
FIGURE 5.
Effect of SLUG on the plakoglobin promoter activity in human breast cancer cells. A, quantitative chromatin immunoprecipitation analysis data show the effect of SLUG knockdown on the binding of SLUG to the promoter of plakoglobin gene in MDA-MB-231 and BT549 cells. Results are the mean ± S.E. (n = 6). * indicates that the changes observed in the SLUG-knockdown cells were statistically significant (p < 0.001). B, quantitative chromatin immunoprecipitation analysis data shows the effect of SLUG knockdown on the binding of CtBP1 and HDAC1 to the promoter of plakoglobin gene in BT549 cells. Results are the mean ± S.E. (n = 6). * indicates that the changes observed in the SLUG-knockdown cells were statistically significant (p < 0.001). C, quantitative chromatin immunoprecipitation analysis data shows the effect of SLUG knockdown on the abundance of acetylated histones H3 and H4 at the promoter of plakoglobin gene in BT549 cells. Results are the mean ± S.E. (n = 6). * indicates that the changes observed in the SLUG-knockdown cells were statistically significant (p < 0.001). D, shown is relative activity of plakoglobin gene promoter in different SLUG negative (MCF7 and MDA-MB-468) and SLUG-positive (MDA-MB-231 and BT549) human breast cancer cells. Results are the mean ± S.E. (n = 6). * indicates statistically significant changes in the promoter activity in the SLUG-positive cells as compared with that in the SLUG-negative MCF7 cells. RLU, relative light units. E, shown is plakoglobin promoter activity in the control (vector-transfected), wild-type (wtSLUG), and mutated non-functional (mtSLUG) SLUG-expressing MCF7 and MDA-MB-468 cells. Results are the mean ± S.E. (n = 6). * indicates statistically significant decrease in the promoter activity in the SLUG-expressing cells as compared with that in the vector-transfected cells (p < 0.001). F, shown is derepression of plakoglobin promoter activity in the SLUG-knocked down (SLUGKD) MDA-MB-231 and BT549 cells. Results are the mean ± S.E. (n = 6). * indicates a statistically significant increase in the promoter activity in the SLUG-knocked down cells as compared with that in the control cells (p < 0.001).
FIGURE 6.
FIGURE 6.
Characteristics of the molecular decoy developed against SLUG. A, shown are nucleotide sequences of the wild-type and the mutant molecular decoys used. F, O, E, and Z indicate phosphorothioate modifications of A, C, G, and T, respectively. B, EMSA analysis shows E2-box-dependent specific binding of nuclear proteins from MDA-MB-231 cell nuclear extract to the wild-type decoy but not to the mutated decoy. Biotin-tagged decoys were used, and the blots were developed with HRP-tagged streptavidin. C, an immuno pulldown assay followed by immunoblot analysis shows the binding of SLUG to the wild-type decoy but not to the mutated decoy. PD, pulldown. (i) the immunoblot shows exclusive location of SLUG in the nuclear fraction of MDA-MB-231 cells. (ii) shown is a pulldown assay for SLUG from the nuclear fraction of MDA-MB-231 cells using biotin-tagged decoys. (iii) the immunoblot shows leftover SLUG in the supernatant after the pulldown assay (one-fifth of the supernatant was loaded). D, an immuno pulldown assay followed by immunoblot (IB) analysis shows weak binding of SNAIL to the decoy. (i) the immunoblot shows exclusive location of SNAIL in the nuclear fraction of MDA-MB-231 cells. (ii) shown is a pulldown assay for SNAIL from the nuclear fraction of MDA-MB-231 cells using biotin-tagged decoys. (iii) the immunoblot shows leftover SNAIL in the supernatant after the pulldown assay (one-fifth of the supernatant was loaded).
FIGURE 7.
FIGURE 7.
Alleviation of the repressor activity of SLUG against plakoglobin gene expression by molecular decoy against SLUG binding to E2-box. A, shown is the effect of the decoy on plakoglobin mRNA level in MDA-MB-231 cells as was determined by real-time RT-PCR analysis. β-Actin mRNA was used as a normalization control. Results are the mean ± S.E. (n = 6). * indicates statistical significance p < 0.001. MT-Decoy. decoy with mutation at the E2-box sequences; WT-Decoy, Decoy with wild-type E2-box sequences. B, Western blot analysis shows the effect of the decoy on plakoglobin protein level in MDA-MB-231 cells. SLUG levels did not significantly alter. β-Actin was used as a loading control. C, shown is densitometric scanning of the Western blots to evaluate the relative levels of SLUG and plakoglobin in MDA-MB-231 cells. Results are the mean ± S.E. (n = 4). * indicates statistical significance p < 0.001. D, shown is immunofluorescence confocal microscopy analysis of the effect of the SLUG decoy on plakoglobin protein (green) levels in MDA-MB-231 cells. TOPRO (blue) was used to stain the nucleus of the cells. E, quantitative evaluation of the relative levels of plakoglobin (with respect to TOPRO staining) in the immunofluorescence images was as in D. Results are the mean ± S.E. (n = 7). The difference in the relative (normalized with TOPRO level) plakoglobin levels between the cells treated with mutant decoy (MT Decoy) and wild-type Decoy (WT Decoy) was statistically significant. ** indicates statistical significance p < 0.01. F, shown is the effect of the decoy on the activity of plakoglobin gene promoter in MDA-MB-231 cells. Results are the mean ± S.E. (n = 6). *** indicates statistically significant changes between the control and the experimental sets (p < 0.05).
FIGURE 8.
FIGURE 8.
Effect of alteration of plakoglobin levels on the motility, actin filament reorganization, and invadopodia formation in breast cancer cells. A, shown is the effect of plakoglobin knockdown (PGKD) on the motility of MCF7 and MDA-MB-468 cells in transwell migration assay. Results are the mean ± S.E. (n = 4). * indicates statistical significance p < 0.001. B, shown is the effect of PGKD on the motility of MDA-MB-468 cells as was evaluated by scratch assay. C, shown is a quantitative evaluation of in vitro motility in the scratch assay (as in B) of the vector control and the PGKD MDA-MB-468 cells at 24 and 48 h. Results are the mean ± S.E. (n = 6). The difference of % restitution at 48 h was statistically significant. ** indicates statistical significance p < 0.01. D, shown is the effect of ectopic expression of plakoglobin (PGOE) on the motility of BT549 cells in the transwell migration assay. Results are the mean ± S.E. (n = 4). ** indicates statistical significance p < 0.01. E, shown is an evaluation of in vitro motility in the scratch assay of the vector control and the PGOE BT549 cells. Results are the mean ± S.E. (n = 6). ** indicates statistical significance p < 0.01.
FIGURE 9.
FIGURE 9.
Effect of alteration of plakoglobin levels on actin filament reorganization and invadopodia formation in breast cancer cells. A, immunofluorescence confocal microscopy shows the effect of knockdown of plakoglobin (green) on actin filament (red) reorganization in MDA-MB-468 cells. Cell nuclei are painted blue with TOPRO. B, higher magnification of the plakoglobin-knocked down MDA-MB-468 cells shows actin filament projections (white arrows), suggesting invadopodia formation in these cells. C, immunofluorescence confocal microscopy shows the effect of transient knockdown of plakoglobin (green) on actin filament projections (red) from the MCF7 cells. Cell nuclei are painted blue with TOPRO. The field shows both plakoglobin-knocked down (PGKD) and control cells. The PGKD cells show actin filament projections (white arrows) characteristic of invadopodia. D, immunofluorescence confocal microscopy shows the effect of forced expression of plakoglobin (green) on actin filament (red) reorganization in BT549 cells. Cell nuclei are painted blue with TOPRO. Snapshots from three slides are shown. Each slide has at least one cell with overexpression of plakoglobin. The invadopodia-like structures are apparent (white arrows) on the cells lacking plakoglobin.
FIGURE 10.
FIGURE 10.
Effect of knockdown of plakoglobin levels on the levels of actin filament-associated protein α-actinin 4 (ACTN4) and MyH9 in the MCF7 cells. A, a Western blot shows a significant increase in the levels of actinin and MyH9 proteins in the plakoglobin-knocked down cells. GAPDH was used as a loading control. B, shown are a densitometric scan for the protein levels in six independent plakoglobin-knocked down populations and the corresponding control siRNA-transfected control cells. Results are the mean ± S.E. (n = 6). * indicates that the -fold changes were statistically significant (p < 0.001). C, immunofluorescence confocal microscopy shows higher levels of actinin (green) in the plakoglobin (red) knocked down MCF7 cells. D, quantitative evaluation of the ratio of actinin/plakoglobin in the immunofluorescence images was in C. Results are the mean ± S.E. (n = 5). * indicates that the changes were statistically significant (p < 0.001). E, immunofluorescence confocal microscopy shows higher levels of MyH9 (red) in the plakoglobin (green) knocked down MCF7 cells. F, quantitative evaluation of the ratio of MyH9/plakoglobin in the immunofluorescence images was as in E. Results are the mean ± S.E. (n = 5). * indicates that the changes were statistically significant (p < 0.001). Snapshots from two slides are shown in C and E. Each slide shows at least one cell with significant knockdown of plakoglobin. Cell nuclei were stained with TOPRO.

Similar articles

Cited by

References

    1. Lehmann B. D., Bauer J. A., Chen X., Sanders M. E., Chakravarthy A. B., Shyr Y., Pietenpol J. A. (2011) Identification of human triple-negative breast cancer subtypes and preclinical models for selection of targeted therapies. J. Clin. Invest. 121, 2750–2767 - PMC - PubMed
    1. Huo D., Ikpatt F., Khramtsov A., Dangou J. M., Nanda R., Dignam J., Zhang B., Grushko T., Zhang C., Oluwasola O., Malaka D., Malami S., Odetunde A., Adeoye A. O., Iyare F., Falusi A., Perou C. M., Olopade O. I. (2009) Population differences in breast cancer. Survey in indigenous African women reveals over-representation of triple-negative breast cancer. J. Clin. Oncol. 27, 4515–4521 - PMC - PubMed
    1. Anders C. K., Carey L. A. (2009) Biology, metastatic patterns, and treatment of patients with triple-negative breast cancer. Clin. Breast Cancer. 9, S73–S81 - PMC - PubMed
    1. O'Brien K. M., Cole S. R., Tse C. K., Perou C. M., Carey L. A., Foulkes W. D., Dressler L. G., Geradts J., Millikan R. C. (2010) Intrinsic breast tumor subtypes, race, and long term survival in the Carolina Breast Cancer Study. Clin. Cancer Res. 16, 6100–6110 - PMC - PubMed
    1. Amirikia K. C., Mills P., Bush J., Newman L. A. (2011) Higher population-based incidence rates of triple-negative breast cancer among young African-American women. Implications for breast cancer screening recommendations. Cancer 117, 2747–2753 - PMC - PubMed

Publication types

MeSH terms