. 2012 Jun;86(11):6246-57.
doi: 10.1128/JVI.07168-11. Epub 2012 Apr 4.

Suppression of antigen-specific T cell responses by the Kaposi's sarcoma-associated herpesvirus viral OX2 protein and its cellular orthologue, CD200

Affiliations

Suppression of antigen-specific T cell responses by the Kaposi's sarcoma-associated herpesvirus viral OX2 protein and its cellular orthologue, CD200

Karen Misstear et al. J Virol. 2012 Jun.

Abstract

Regulating appropriate activation of the immune response in the healthy host despite continual immune surveillance dictates that immune responses must be either self-limiting and therefore negatively regulated following their activation or prevented from developing inappropriately. In the case of antigen-specific T cells, their response is attenuated by several mechanisms, including ligation of CTLA-4 and PD-1. Through the study of the viral OX2 (vOX2) immunoregulator encoded by Kaposi's sarcoma-associated herpesvirus (KSHV), we have identified a T cell-attenuating role both for this protein and for CD200, a cellular orthologue of the viral vOX2 protein. In vitro, antigen-presenting cells (APC) expressing either native vOX2 or CD200 suppressed two functions of cognate antigen-specific T cell clones: gamma interferon (IFN-γ) production and mobilization of CD107a, a cytolytic granule component and measure of target cell killing ability. Mechanistically, vOX2 and CD200 expression on APC suppressed the phosphorylation of ERK1/2 mitogen-activated protein kinase in responding T cells. These data provide the first evidence for a role of both KSHV vOX2 and cellular CD200 in the negative regulation of antigen-specific T cell responses. They suggest that KSHV has evolved to harness the host CD200-based mechanism of attenuation of T cell responses to facilitate virus persistence and dissemination within the infected individual. Moreover, our studies define a new paradigm in immune modulation by viruses: the provision of a negative costimulatory signal to T cells by a virus-encoded orthologue of CD200.


Figures

Fig 1
Fig 1
KSHV vOX2 inhibits allostimulation in the one-way MLR assay. The impact of native, transmembrane vOX2 protein in U937 stimulator cells was evaluated by the one-way MLR in human PBMC, quantifying [3H]thymidine incorporation after 4 days of coculture. The data represent the responses of four donors' PBMC, each cocultured in triplicate with either the stimulator U937 cells stably transfected with a vOX2 expression vector (U937.vOX2) or stably transfected with plasmid vector lacking vOX2 (U937.pBK). Alternatively, stimulation with a pool of PBMC from five donors served as the positive control (PBMC panel). The level of [3H]thymidine incorporation was normalized to that induced by U937.pBK. *, P = 0.02 (U937.vOX2 versus U937.pBK, nonparametric Mann-Whitney U test).
Fig 2
Fig 2
Inhibition of antigen-specific T cell restimulation by autologous APC expressing either vOX2 or CD200. An autologous keratinocyte cell line was derived from EBV-seropositive donor 1 by immortalizing primary keratinocytes cultured from a skin punch biopsy specimen from this donor with SV40. Derivative APC lines were transduced with a retroviral vector to express either vOX2 (vOX2) or CD200 (CD200) or with the parental retroviral vector pQCXIP lacking an inserted gene (Empty). PBMC from donor 1 were prepared from freshly obtained whole blood. APC lines were pulsed with HLA-A2-restricted peptide antigen and cocultured with PBMC for 16 h. The extent of antigen-specific T cell restimulation was measured by quantifying IFN-γ production by ELISA. The data are from one experiment performed in duplicate and representative of three.
Fig 3
Fig 3
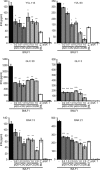
Expression of either vOX2 or CD200 on HEK293 and MJS APC reduces the production of IFN-γ by CD8+ T cell clones. EBV-specific, CD8+ T cell clones were cocultured with HLA-matched HEK293 (HLA-A2-expressing) or MJS (HLA-B8-expressing) APC transiently transfected with plasmid vectors expressing a cognate antigen, i.e., BRLF1 (HEK293, upper row), BMLF1 (HEK293, middle row), or BZLF1 (MJS, lower row). In order to determine the effect of the cell surface expression of either vOX2 or CD200 on T cell IFN-γ production, APC were cotransfected with increasing amounts (0.2 to 2.0 μg) of a plasmid expressing either of these proteins. The total plasmid load for each transfection was normalized among all of the APC used in an experiment with empty expression vector pQCXIP (pQX). The data for six clones in total are presented, with two T cell clones specific for each of the three antigens: BRLF1 (top row), clones YVL 113 and YVL 63; BMLF1 (middle row), clones GLC 30 and GLC 3; BZLF1 (bottom row), clones RAK 13 and RAK 21. T cell responses were quantified by IFN-γ ELISA after 16 h of coculture. −, APC transfected with the EBV antigen-expressing vector and the empty vector lacking either vOX2 or CD200. pQX-vOX2, APC transfected with increasing amounts of an expression vector for the KSHV vOX2 protein. pQX-CD200, APC transfected with increasing amounts of an expression vector for the cellular CD200 protein. BILF1, APC transfected with an expression vector for the known EBV-encoded T cell inhibitory protein BILF1 (54). pQX, APC transfected with only the empty expression vector (pQCXIP) lacking EBV antigen. T, cultures lacking APC. The data are from one experiment performed in triplicate and representative of two to four independent replicate experiments for each T cell clone. *, P < 0.05; **, P < 0.01; ***, P < 0.001 (Student's one-tailed t test compared to the negative control [APC expressing antigen but not vOX2 or CD200] for all replicate experiments).
Fig 4
Fig 4
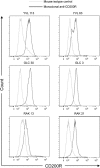
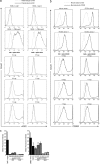
CD200R expression on the antigen-specific T cell clone surface. The expression of CD200R on CD8+ antigen-specific T cell clones was confirmed by flow cytometry. These data were acquired from aliquots of cells at the same time as their functional analyses were performed (Fig. 3). They are representative of replicates performed at least three times.
Fig 5
Fig 5
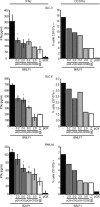
Investigation of whether vOX2 and CD200 are capable of suppressing cytotoxic T cell activity. EBV-specific, CD8+ T cell clones were cocultured with HLA-matched HEK293 (HLA-A2-expressing) or MJS (HLA-B8-expressing) APC transiently transfected with plasmid vectors expressing a cognate antigen, either BMLF-1 (upper and middle rows) or BZLF-1 (lower row). In order to determine the effect of the cell surface expression of vOX2 or CD200 on T cell surface CD107a levels (a measure of degranulation), APC were cotransfected with a plasmid expressing either of them. The total plasmid load for each transfection was normalized among all of the APC used in an experiment with empty expression vector pQX. The data for three clones are presented. T cell surface CD107a expression was quantified by flow cytometry after 5 h of coculture in the presence of monensin. T cell IFN-γ production was also quantified by ELISA performed with medium samples taken from parallel cocultures of T cells and APC after 16 h. −, APC transfected with the EBV antigen-expressing vector and the empty vector lacking either vOX2 or CD200. pQX-vOX2, APC transfected with increasing amounts of an expression vector for the KSHV vOX2 protein. pQX-CD200, APC transfected with increasing amounts of an expression vector for the cellular CD200 protein. BILF1, APC transfected with an expression vector for the known EBV-encoded T cell inhibitory protein BILF1 (54). pQX, APC transfected with only the empty expression vector lacking EBV antigen. These data from a single experiment performed in duplicate are representative of two or three performed separately and two for the CD107a studies. *, P < 0.05; ***, P < 0.001 (Student's 1-tailed t test compared to the negative control [APC expressing antigen but not vOX2 or CD200] for all replicate experiments). Statistical analyses of the CD107a data were not determined due to the biological variability of absolute percentages between replicate experiments, but the trend was the same between replicates.
Fig 6
Fig 6
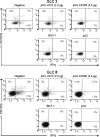
vOX2 or CD200 suppression of CD107a degranulation and IFN-γ production by antigen-specific T cells. Shown are representative dot plot data from which those of Fig. 5 are derived. CD107a degranulation (y axis) and IFN-γ production (x axis) are presented for two T cell clones, GLC 3 and GLC 8. The percentages in each plot are the percentages of cells in the quadrants. For experimental details, see the legend to Fig. 5. −, APC transfected with the EBV antigen-expressing vector and the empty vector lacking either vOX2 or CD200. pQX-vOX2 (2.0 μg), APC transfected with 2.0 μg of an expression vector for the KSHV vOX2 protein. pQX-CD200 (2.0 μg), APC transfected with 2.0 μg of an expression vector for the cellular CD200 protein. BILF1, APC transfected with an expression vector for the known EBV-encoded T cell inhibitory protein BILF1 (54). pQX, APC transfected with only the empty expression vector lacking EBV antigen.
Fig 7
Fig 7
Comparison of native levels of vOX2 and CD200 expression with those of cells transfected with expression vectors for either protein. (a) Quantification of vOX2 expression by fluorescence. Shown are representative histogram data from which those of panel c (left panel) were derived. KSHV in BCBL-1 cells was reactivated into lytic replication by the addition of 75 mM phorbol myristate acetate for 72 h in order to detect vOX2 expression. Data from two experiments (expt. 1 and expt. 2) are shown. To compare these levels with those of vOX2 expression in transfected APC, data are shown for HEK293 and MJS APC transfected with increasing amounts of vOX2 expression vector pQX-vOX2. (a) Quantification of CD200 expression by fluorescence. Shown are representative histogram data from which those of panel c (right side) were derived. CD200 expression in CD19+ or HUVEC from two donors is shown. To compare these levels with those of CD200 expression in transfected APC, data are shown for HEK293 and MJS APC transfected with increasing amounts of the CD200 expression vector pQX-CD200. (c, left side) Comparison of endogenous vOX2 expression levels on BCBL-1 cells treated to reactivate KSHV lytic replication with ectopic levels of HEK293 and MJS APC transfected with a vOX2 expression vector. (c, right side) Comparison of natural CD200 expression levels on CD19+ cells and HUVEC with ectopic levels of HEK293 and MJS APC transfected with the CD200 expression vector. Cells were transiently transfected with either pQX-vOX2 or pQX-CD200 for use as APC in T cell coincubation experiments (Fig. 3 and 5), and aliquots were stained with an anti-vOX2, an anti-CD200, or an isotype-matched control antibody. The level of vOX2 and CD200 expression was quantified by flow cytometry, and the average median fluorescence intensity calculated with FlowJo software from three experiments performed separately is shown.
Fig 8
Fig 8
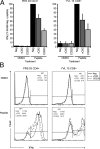
Expression of vOX2 and CD200 on BJAB APC reduces the accumulation of intracellular IFN-γ in CD4+ and CD8+ T cell clones. EBV antigen-specific T cell clones were cocultured with cognate antigen peptide-pulsed BJAB cells transduced with a retroviral vector to express either vOX2 (vOX2) or CD200 (CD200) or with the parental retroviral pQCXIP vector lacking an inserted gene (negative vector, Neg). Peptides were PRS (HLA DRB3*0201-restricted) for PRS 93 CD4+ and YVL (HLA-A2 restricted) for YVL 15 CD8+. Intracellular IFN-γ was quantified by flow cytometry as median fluorescence intensity values. (A) Cumulative data from three independent experiments were pooled and normalized to the levels obtained in parallel with peptide antigen-pulsed BJAB cells transduced with the parental pQCXIP vector lacking either vOX2 or CD200 (Neg) to generate the parameter plotted, i.e., percent negative BJAB cells plus peptide. The data are presented as this normalized mean ± the standard error of the mean. *, P < 0.05, **, P < 0.01, ***, P < 0.001 (Student's one-tailed t test). (B) Data from one representative experiment are depicted for each clone. In the upper row, data are shown for cells treated without peptide (DMSO vehicle alone) and the lower row depicts data for cognate-peptide-treated cells. The left-hand marker was set to gate 99% of the cells from the unstimulated negative sample to be IFN-γ negative; a shift of the fluorescence to the right indicates greater IFN-γ production. The median fluorescence intensity (MFI) values for this experiment are presented within each histogram.
Fig 9
Fig 9
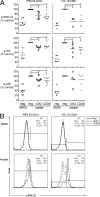
Expression of either vOX2 or CD200 on the surface of the cognate APC significantly reduces the phosphorylation of ERK1/2 and Akt in the T cell. Two human T cell clones (PRS 93 CD4+ and YVL 15 CD8+) were incubated for 5 min with cognate antigen peptide-pulsed BJAB cells transduced with a retroviral vector to express either vOX2 or CD200 or with the parental retroviral pQCXIP vector lacking an inserted gene (negative vector, Neg). Target signaling molecules were detected by antibody staining and quantified by flow cytometry. (A) Phosphoprotein levels (median fluorescence intensity) for each experiment were normalized to the levels obtained in parallel with peptide antigen-pulsed BJAB cells transduced with the parental pQCXIP vector lacking either vOX2 or CD200 (Neg) to generate the parameter plotted, i.e., percent control. Each icon indicates an independent experiment. The mean of each sample group is represented by a horizontal bar. *, P < 0.05; **, P < 0.01; ***, P < 0.001 (Student's one-tailed t test). (B) Data from one representative experiment quantifying p-ERK-1/2 are depicted for each clone. In the upper row, data are shown for cells treated without peptide (DMSO vehicle alone) and the lower row depicts data for cognate-peptide-treated cells. The left-hand marker was set to gate 99% of the cells from the DMSO-treated negative sample to be p-ERK-1/2 negative; a shift of the fluorescence to the right indicates greater ERK-1/2 phosphorylation. The median fluorescence intensity (MFI) values for this experiment are presented within each histogram.

Similar articles

Cited by

References

    1. Alberola-Ila J, Hernandez-Hoyos G. 2003. The Ras/MAPK cascade and the control of positive selection. Immunol. Rev. 191:79–96 - PubMed
    1. Alegre ML, Frauwirth KA, Thompson CB. 2001. T-cell regulation by CD28 and CTLA-4. Nat. Rev. Immunol. 1:220–228 - PubMed
    1. Aresté C, Blackbourn DJ. 2009. Modulation of the immune system by Kaposi's sarcoma-associated herpesvirus. Trends Microbiol. 17:119–129 - PubMed
    1. Au-Yeung BB, et al. 2009. The structure, regulation, and function of ZAP-70. Immunol. Rev. 228:41–57 - PubMed
    1. Blackbourn DJ, et al. 1997. CD8+ cells from HIV-2-infected baboons control HIV replication. AIDS 11:737–746 - PubMed

Publication types

MeSH terms

LinkOut - more resources