. 2012 Apr 20;287(17):14270-9.
doi: 10.1074/jbc.M112.354548. Epub 2012 Feb 28.

Hindgut innate immunity and regulation of fecal microbiota through melanization in insects

Affiliations

Hindgut innate immunity and regulation of fecal microbiota through melanization in insects

Qimiao Shao et al. J Biol Chem. .

Abstract

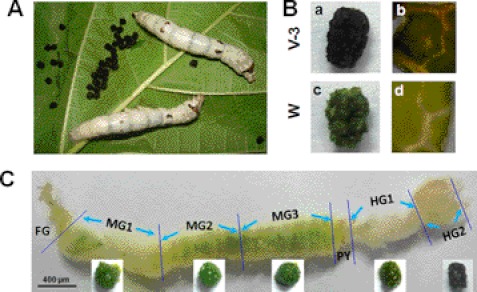
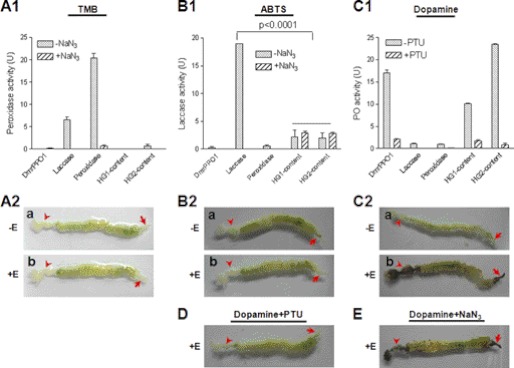
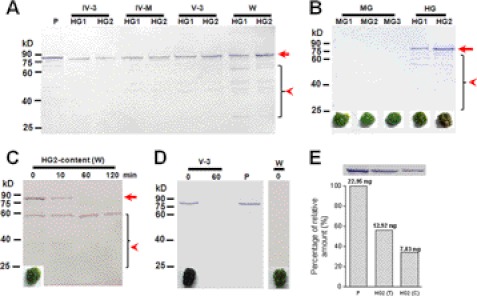
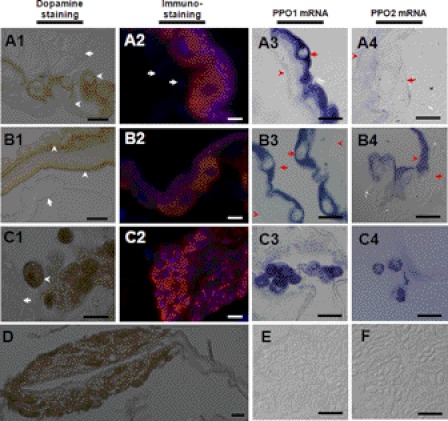
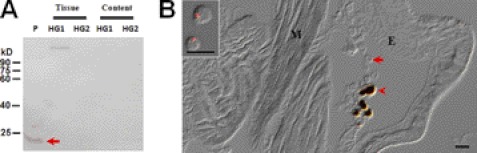
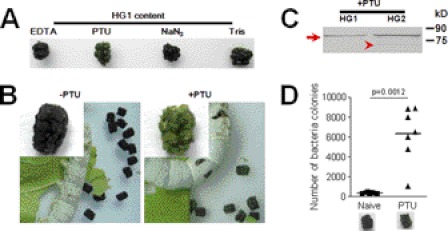
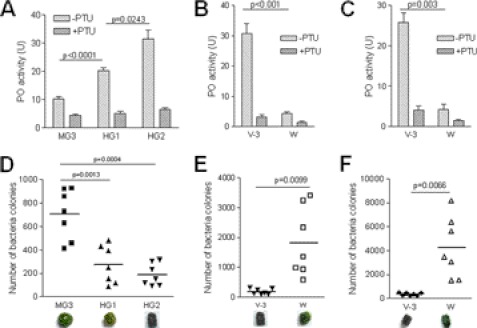
Many insects eat the green leaves of plants but excrete black feces in an as yet unknown mechanism. Insects cannot avoid ingesting pathogens with food that will be specifically detected by the midgut immune system. However, just as in mammals, many pathogens can still escape the insect midgut immune system and arrive in the hindgut, where they are excreted out with the feces. Here we show that the melanization of hindgut content induced by prophenoloxidase, a key enzyme that induces the production of melanin around invaders and at wound sites, is the last line of immune defense to clear bacteria before feces excretion. We used the silkworm Bombyx mori as a model and found that prophenoloxidase produced by hindgut cells is secreted into the hindgut contents. Several experiments were done to clearly demonstrate that the blackening of the insect feces was due to activated phenoloxidase, which served to regulate the number of bacteria in the hindgut. Our analysis of the silkworm hindgut prophenoloxidase discloses the natural secret of why the phytophagous insect feces is black and provides insight into hindgut innate immunity, which is still rather unclear in mammals.


Figures

FIGURE 1.
FIGURE 1.
Black feces excreted by silkworm larvae. A, V-3 silkworm larvae, black feces, and mulberry leaves. B, morphology of black feces excreted by feeding-stage larvae (V-3) and that of green feces excreted by wandering-stage (W) larvae. The mulberry leaf fragments were black (b) or green (d) in the corresponding black (a) or green (c) feces. C, morphology of the gut dissected from a V-3 silkworm larva, and its gut content from the corresponding location. The midgut is equally divided into three parts (MG1, MG2, and MG3). The hindgut is divided into two parts due to its different morphology (HG1 and HG2). The HG2 content was black. FG, foregut; MG, midgut; HG, hindgut; PY, pylorus.
FIGURE 2.
FIGURE 2.
Comparison of the enzyme activity of three oxidases and gut staining. DmrPPO1 was activated by ethanol (E) to have PO activity (16). A1 and A2, peroxidase activity detection. Peroxidase (1.67 ng) and laccase (3 μg) but not DmrPPO1 (1.25 μg) oxidized TMB. No peroxidase activity was detected in HG1 or HG2 content (A1) or in different parts of gut (A2). B1 and B2, laccase activity detection. DmrPPO1 and peroxidase only minimally oxidized ABTS. Some activities were detected in the HG1 and HG2 contents, but they were not inhibited by NaN3 (B1). The real laccase activity was significantly inhibited by NaN3. No laccase activity was detected in the gut (B2). C1 and C2, PO activity detection. Laccase and peroxidase minimally oxidized dopamine. HG1 and HG2 content had obviously high PO activity (C1). The foregut and hindgut stained black only if ethanol was used for activation (C2-b was imaged at 30 min). D and E, effects of laccase and peroxidase inhibitor NaN3 and PO inhibitor PTU on gut staining. PTU significantly inhibited melanization in the foregut and hindgut (D), whereas NaN3 did not (E). Columns represent the mean of individual measurements ± S.E. (n = 3). Significant differences were calculated with an unpaired t test program.
FIGURE 3.
FIGURE 3.
Western blot analysis of PPO in the hindgut and hindgut content of silkworm larvae. A, PPO was detected in the hindgut (HG1 and HG2) from larvae at different developmental stages. B, PPO was present in the contents of both hindgut regions, but was a little degraded during preparation. Corresponding gut content is shown under each lane. C, quick degradation of PPO in HG2 contents from larvae on wandering-stage. HG2 contents were suspended and incubated at room temperature for different times. PPO was almost degraded within 10 min. The arrow indicates PPO. The arrowhead indicates degraded PPO bands. D, PPO detected in feces. PPO was detected in freshly excreted feces from larvae on V-3 (black feces) but not on wandering-stage (green feces) by Western blot. E, comparison of PPO in plasma (0.5 μl), HG2 tissue supernatant (HG2(T), 10 μg), and HG2 content (HG2(C), collected from five larvae, with 10% of the suspension solution loaded). Band intensities were normalized to the amount of PPO in plasma in lane 1. About 45.9 ng of purified PPO was found in 1 μl of plasma (28). There was 12.92 ng of PPO in 10 μg of HG2 tissue supernatant. The amount of PPO in H2 content was 15.7 ng (7.83 ng × 10 ÷ 5) on average. P: plasma (V-3).
FIGURE 4.
FIGURE 4.
PPO is produced by hindgut cells. (A1, A2, A3, A4) HG1; (B1, B2, B3, B4, C1, C2, C3, C4) HG2. (A1, B1, C1, D) hindguts were sectioned for morphological observation after dopamine staining. Large epidemical cells in HG1 and HG2 stained brown, indicating activated PO oxidation of substrates. Some positively stained small cells were found in HG2 (C1), which were probably released from cyst-like tissue (D). Arrows indicate negatively stained muscle (A1), Malpighian tubules (B1 and C1). Arrowheads indicate positively stained large epidemical cells and membrane-like structures. (A2, B2, C2) immunostained cells in hindguts. Arrows indicate muscle cell that were not labeled by PPO antibody. Many small cells in the cyst were also positively stained (C2). (A3, B3, C3, A4, B4, C4, E, F) PPO1 and PPO2 mRNA levels in hindguts (A3, B3, C3, A4, B4, C4) and midguts (E, F) by in situ hybridization. PPO1 mRNA was observed in the arrow-indicated HG1 (A3) and HG2 large epidemical cells (B3). The PPO2 signal was extremely weak in large epidemical cells (A4, B4) (arrow-indicated). PPO1 (C3) and PPO2 (C4) mRNA was observed in small cells in HG2. No PPO1 (E) and PPO2 mRNA (F) was observed in the midgut. In A3, A4, B3, B4, the arrows indicate membrane-like structures. This work was repeated at least three times with similar results. Bars: C1, A2, B2, C2: 10 μm; all others: 20 μm.
FIGURE 5.
FIGURE 5.
PPO in hindgut is not from hemolymph contamination. A, lysozyme was used as a probe to detect whether there is a physical connection between the hemolymph and hindgut. V-3 silkworm larvae were injected with dead E. coli. The hindguts and its contents were sampled after 12 h and treated as in Fig. 3. Lysozyme was found in plasma but not in the hindguts or its contents by Western blot assay. B, small cells inside HG2 were not labeled by the injected fluorescent beads. The phagocytosed fluorescent beads by hemocytes were used as probes to monitor hemocytes movement (17). After injection of fluorescent beads as previously described (17), circulating hemocytes were observed to have the phagocytosed beads (inset). However, no signal was detected inside the small cells of HG2. The arrow indicates a small cell inside HG2. Some cells became auto-melanized (arrowhead) during the preparation because of PPO activation. The images were merged from those taken using red filter and DIC optics. P: plasma; HG, hindgut; M: muscle; E: large epidemical cells. Bar: 20 μm.
FIGURE 6.
FIGURE 6.
Melanization of silkworm feces is inhibited by the PO inhibitor PTU. A, PTU inhibited melanization of HG1 content. HG1 content was removed and dipped into different solutions. Then the contents were placed on new parafilm, and the extra solution was absorbed. HG1 content became black within 20 min after being dipped into EDTA, NaN3, and Tris solution. PTU inhibited HG1 content melanization. B, PTU solution was spread on mulberry leaves fed to the silkworm larvae. One day later, feces excreted by PTU-fed silkworm larvae were green. C, PTU did not inhibit PPO production or secretion. The arrow and arrowhead indicate PPO and PO, respectively, detected in green feces. D, feeding PTU increased the number of bacterial colonies in green feces. The excreted green feces was suspended for bacterial culture after PTU feeding. Each dot corresponds to the colonies of bacteria suspended from gut content or feces from one silkworm larva. The average for each group is indicated by a horizontal black bar (n = 7). Significant differences were calculated with an unpaired t test program.
FIGURE 7.
FIGURE 7.
PO activity regulating bacteria number in hindgut and feces. A–C, PO activities were compared among different parts of gut contents from V-3 larvae (A) as well as among HG2 contents (B) and fresh feces (C) from V-3 and wandering-stage larvae, respectively. PO activities in the gut contents of V-3 larvae are: HG2>HG1>MG3 (A). PO activities in the hindgut contents (B) and fresh feces (C) of V-3 larvae were higher than in those of wandering-stage larvae, respectively. Columns represent the mean of individual animal measurements ± S.E. (n = 5). D–F, bacteria number in the gut contents and fresh feces. Bacteria colonies in the gut contents and fresh feces from V-3 and wandering-stage larvae as shown in A–C, were counted after being cultured. The bacterial number was significantly lower when PO activity was high in gut contents (D, E) and fresh feces (F). Each dot corresponds to the colonies of bacteria suspended from gut content or feces from one silkworm larva. The average for each group is indicated by a horizontal black bar (n = 7). Significant differences were calculated using an unpaired t test program.

Similar articles

Cited by

References

    1. Walter J., Ley R. (2011) The human gut microbiome: ecology and recent evolutionary changes. Annu. Rev. Microbiol. 65, 411–429 - PubMed
    1. Field K. G., Samadpour M. (2007) Fecal source tracking, the indicator paradigm, and managing water quality. Water Res. 41, 3517–3538 - PubMed
    1. Dillon R. J., Dillon V. M. (2004) The gut bacteria of insects: nonpathogenic interactions. Annu. Rev. Entomol. 49, 71–92 - PubMed
    1. Apidianakis Y., Rahme L. G. (2011) Drosophila melanogaster as a model for human intestinal infection and pathology. Dis. Model. Mech. 4, 21–30 - PMC - PubMed
    1. Hakim R. S., Baldwin K., Smagghe G. (2010) Regulation of midgut growth, development, and metamorphosis. Annu. Rev. Entomol. 55, 593–608 - PubMed

Publication types

LinkOut - more resources