

Transcriptomic analysis comparing tumor-associated neutrophils with granulocytic myeloid-derived suppressor cells and normal neutrophils
- PMID: 22348096
- PMCID: PMC3279406
- DOI: 10.1371/journal.pone.0031524
Transcriptomic analysis comparing tumor-associated neutrophils with granulocytic myeloid-derived suppressor cells and normal neutrophils
Abstract
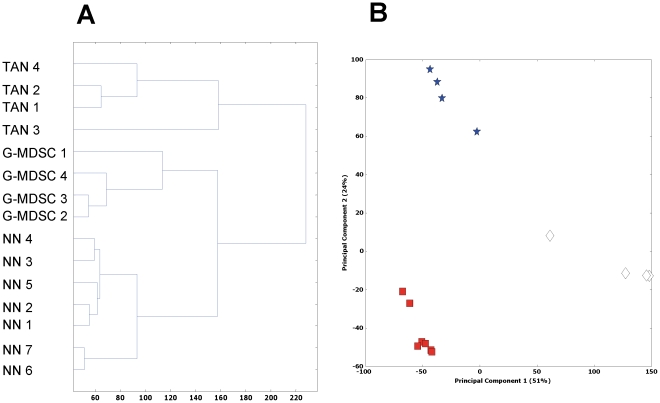
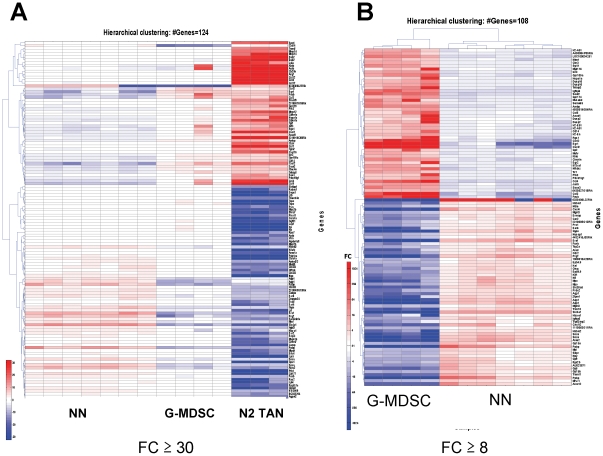
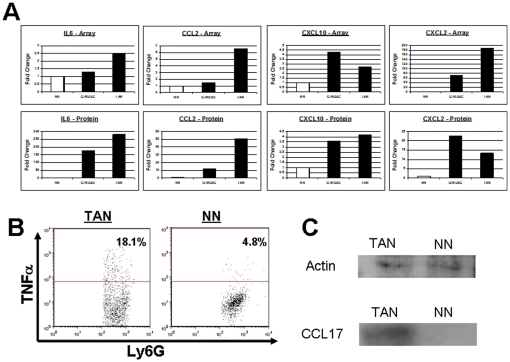
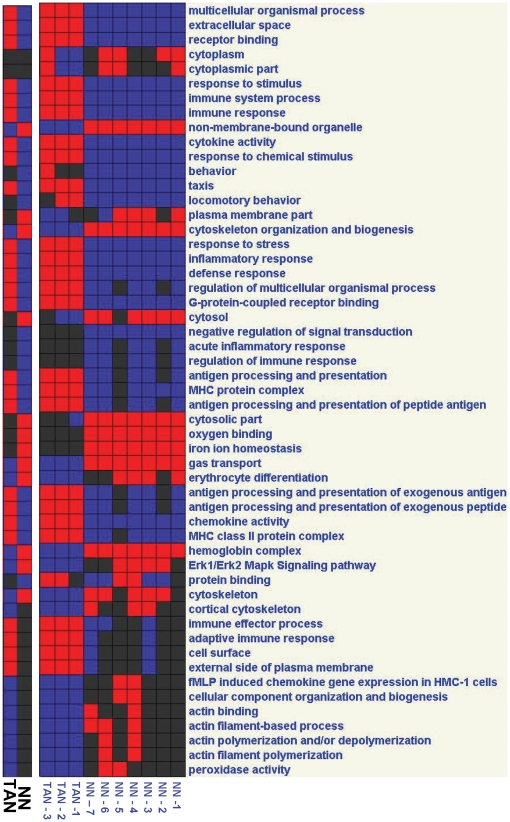
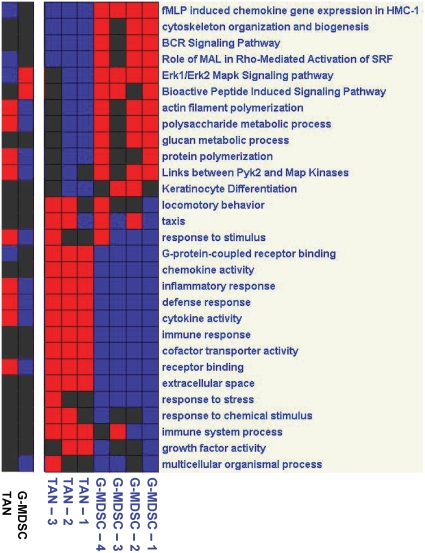
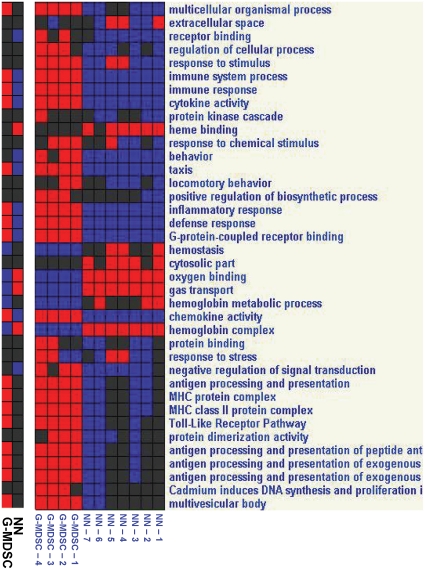
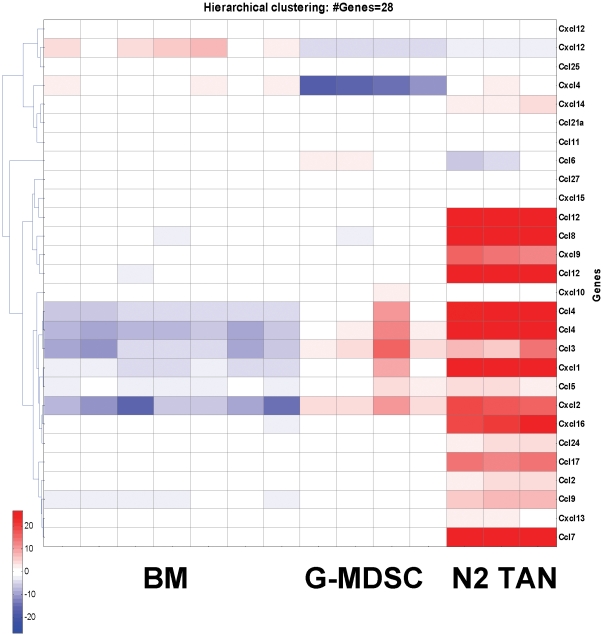
The role of myeloid cells in supporting cancer growth is well established. Most work has focused on myeloid-derived suppressor cells (MDSC) that accumulate in tumor-bearing animals, but tumor-associated neutrophils (TAN) are also known to be capable of augmenting tumor growth. However, little is known about their evolution, phenotype, and relationship to naïve neutrophils (NN) and to the granulocytic fraction of MDSC (G-MDSC).In the current study, a transcriptomics approach was used in mice to compare these cell types. Our data show that the three populations of neutrophils are significantly different in their mRNA profiles with NN and G-MDSC being more closely related to each other than to TAN. Structural genes and genes related to cell-cytotoxicity (i.e. respiratory burst) were significantly down-regulated in TAN. In contrast, many immune-related genes and pathways, including genes related to the antigen presenting complex (e.g. all six MHC-II complex genes), and cytokines (e.g. TNF-α, IL-1-α/β), were up-regulated in G-MDSC, and further up-regulated in TAN. Thirteen of the 25 chemokines tested were markedly up-regulated in TAN compared to NN, including striking up-regulation of chemoattractants for T/B-cells, neutrophils and macrophages.This study characterizes different populations of neutrophils related to cancer, pointing out the major differences between TAN and the other neutrophil populations.
Conflict of interest statement
Figures
Similar articles
-
Tumor-associated neutrophils: friend or foe?Carcinogenesis. 2012 May;33(5):949-55. doi: 10.1093/carcin/bgs123. Epub 2012 Mar 16. Carcinogenesis. 2012. PMID: 22425643 Review.
-
Identification of granulocytic myeloid-derived suppressor cells (G-MDSCs) in the peripheral blood of Hodgkin and non-Hodgkin lymphoma patients.Oncotarget. 2016 May 10;7(19):27676-88. doi: 10.18632/oncotarget.8507. Oncotarget. 2016. PMID: 27050283 Free PMC article.
-
The kinship of neutrophils and granulocytic myeloid-derived suppressor cells in cancer: cousins, siblings or twins?Semin Cancer Biol. 2013 Jun;23(3):171-82. doi: 10.1016/j.semcancer.2013.02.007. Epub 2013 Feb 28. Semin Cancer Biol. 2013. PMID: 23459190 Review.
-
Arginase I-producing myeloid-derived suppressor cells in renal cell carcinoma are a subpopulation of activated granulocytes.Cancer Res. 2009 Feb 15;69(4):1553-60. doi: 10.1158/0008-5472.CAN-08-1921. Epub 2009 Feb 5. Cancer Res. 2009. PMID: 19201693 Free PMC article.
-
Human neutrophils: Their role in cancer and relation to myeloid-derived suppressor cells.Semin Immunol. 2016 Apr;28(2):187-96. doi: 10.1016/j.smim.2016.03.018. Epub 2016 Apr 7. Semin Immunol. 2016. PMID: 27067179 Review.
Cited by
-
Innate Immune Defense Mechanisms by Myeloid Cells That Hamper Cancer Immunotherapy.Front Immunol. 2020 Jul 9;11:1395. doi: 10.3389/fimmu.2020.01395. eCollection 2020. Front Immunol. 2020. PMID: 32733461 Free PMC article. Review.
-
A heparan-sulfate-bearing syndecan-1 glycoform is a distinct surface marker for intra-tumoral myeloid-derived suppressor cells.iScience. 2021 Oct 29;24(11):103349. doi: 10.1016/j.isci.2021.103349. eCollection 2021 Nov 19. iScience. 2021. PMID: 34825135 Free PMC article.
-
The Generation and Identity of Human Myeloid-Derived Suppressor Cells.Front Oncol. 2020 Feb 7;10:109. doi: 10.3389/fonc.2020.00109. eCollection 2020. Front Oncol. 2020. PMID: 32117758 Free PMC article. Review.
-
Role of Rip2 in development of tumor-infiltrating MDSCs and bladder cancer metastasis.PLoS One. 2014 Apr 14;9(4):e94793. doi: 10.1371/journal.pone.0094793. eCollection 2014. PLoS One. 2014. PMID: 24733360 Free PMC article.
-
Neutrophil sub-types in maintaining immune homeostasis during steady state, infections and sterile inflammation.Inflamm Res. 2023 Jun;72(6):1175-1192. doi: 10.1007/s00011-023-01737-9. Epub 2023 May 22. Inflamm Res. 2023. PMID: 37212866 Free PMC article. Review.
References
Publication types
MeSH terms
Substances
Grants and funding
LinkOut - more resources
Full Text Sources
Other Literature Sources
Molecular Biology Databases
Research Materials
