A comprehensive survey of genomic alterations in gastric cancer reveals systematic patterns of molecular exclusivity and co-occurrence among distinct therapeutic targets
- PMID: 22315472
- PMCID: PMC3322587
- DOI: 10.1136/gutjnl-2011-301839
A comprehensive survey of genomic alterations in gastric cancer reveals systematic patterns of molecular exclusivity and co-occurrence among distinct therapeutic targets
Abstract
Objective: Gastric cancer is a major gastrointestinal malignancy for which targeted therapies are emerging as treatment options. This study sought to identify the most prevalent molecular targets in gastric cancer and to elucidate systematic patterns of exclusivity and co-occurrence among these targets, through comprehensive genomic analysis of a large panel of gastric cancers.
Design: Using high-resolution single nucleotide polymorphism arrays, copy number alterations were profiled in a panel of 233 gastric cancers (193 primary tumours, 40 cell lines) and 98 primary matched gastric non-malignant samples. For selected alterations, their impact on gene expression and clinical outcome were evaluated.
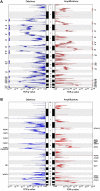
Results: 22 recurrent focal alterations (13 amplifications and nine deletions) were identified. These included both known targets (FGFR2, ERBB2) and also novel genes in gastric cancer (KLF5, GATA6). Receptor tyrosine kinase (RTK)/RAS alterations were found to be frequent in gastric cancer. This study also demonstrates, for the first time, that these alterations occur in a mutually exclusive fashion, with KRAS gene amplifications highlighting a clinically relevant but previously underappreciated gastric cancer subgroup. FGFR2-amplified gastric cancers were also shown to be sensitive to dovitinib, an orally bioavailable FGFR/VEGFR targeting agent, potentially representing a subtype-specific therapy for FGFR2-amplified gastric cancers.
Conclusion: The study demonstrates the existence of five distinct gastric cancer patient subgroups, defined by the signature genomic alterations FGFR2 (9% of tumours), KRAS (9%), EGFR (8%), ERBB2 (7%) and MET (4%). Collectively, these subgroups suggest that at least 37% of gastric cancer patients may be potentially treatable by RTK/RAS directed therapies.
Conflict of interest statement
Figures


Comment in
-
Exclusive rights in gastric cancer genomics.Gut. 2012 May;61(5):638-40. doi: 10.1136/gutjnl-2012-302334. Gut. 2012. PMID: 22491498 No abstract available.
-
[Is classification of gastric cancer according to distinct therapeutic targets applicable in clinical practice?].Korean J Gastroenterol. 2013 Aug 25;62(2):140-1. doi: 10.4166/kjg.2013.62.2.140. Korean J Gastroenterol. 2013. PMID: 24133715 Korean. No abstract available.
Similar articles
-
Mutually exclusive FGFR2, HER2, and KRAS gene amplifications in gastric cancer revealed by multicolour FISH.Cancer Lett. 2014 Oct 28;353(2):167-75. doi: 10.1016/j.canlet.2014.07.021. Epub 2014 Jul 30. Cancer Lett. 2014. PMID: 25086186
-
HER2, MET and FGFR2 oncogenic driver alterations define distinct molecular segments for targeted therapies in gastric carcinoma.Br J Cancer. 2014 Mar 4;110(5):1169-78. doi: 10.1038/bjc.2014.61. Epub 2014 Feb 11. Br J Cancer. 2014. PMID: 24518603 Free PMC article.
-
Establishment of patient-derived gastric cancer xenografts: a useful tool for preclinical evaluation of targeted therapies involving alterations in HER-2, MET and FGFR2 signaling pathways.BMC Cancer. 2017 Mar 14;17(1):191. doi: 10.1186/s12885-017-3177-9. BMC Cancer. 2017. PMID: 28292264 Free PMC article.
-
Innovative personalized medicine in gastric cancer: time to move forward.Clin Genet. 2014 Jul;86(1):37-43. doi: 10.1111/cge.12408. Epub 2014 May 10. Clin Genet. 2014. PMID: 24749947 Review.
-
Targeting the MET Pathway in Gastric and Oesophageal Cancers: Refining the Optimal Approach.Clin Oncol (R Coll Radiol). 2016 Aug;28(8):e35-44. doi: 10.1016/j.clon.2016.01.009. Epub 2016 Feb 13. Clin Oncol (R Coll Radiol). 2016. PMID: 26880063 Review.
Cited by
-
KRAS and BRAF mutations are rare and related to DNA mismatch repair deficiency in gastric cancer from the East and the West: results from a large international multicentre study.Br J Cancer. 2013 Apr 16;108(7):1495-501. doi: 10.1038/bjc.2013.109. Epub 2013 Mar 19. Br J Cancer. 2013. PMID: 23511561 Free PMC article.
-
Whole genome sequencing analysis identifies recurrent structural alterations in esophageal squamous cell carcinoma.PeerJ. 2020 Jun 26;8:e9294. doi: 10.7717/peerj.9294. eCollection 2020. PeerJ. 2020. PMID: 32617189 Free PMC article.
-
MET in gastric cancer--discarding a 10% cutoff rule.Histopathology. 2016 Jan;68(2):241-53. doi: 10.1111/his.12745. Epub 2015 Jul 14. Histopathology. 2016. PMID: 26033401 Free PMC article.
-
Next-generation clinical trials: Novel strategies to address the challenge of tumor molecular heterogeneity.Mol Oncol. 2015 May;9(5):967-96. doi: 10.1016/j.molonc.2014.09.011. Epub 2014 Oct 18. Mol Oncol. 2015. PMID: 25557400 Free PMC article. Review.
-
FGFR inhibitors: Effects on cancer cells, tumor microenvironment and whole-body homeostasis (Review).Int J Mol Med. 2016 Jul;38(1):3-15. doi: 10.3892/ijmm.2016.2620. Epub 2016 May 31. Int J Mol Med. 2016. PMID: 27245147 Free PMC article. Review.
References
-
- Brenner H, Rothenbacher D, Arndt V. Epidemiology of stomach cancer. Methods Mol Biol 2009;472:467–77 - PubMed
-
- Kamangar F, Dores GM, Anderson WF. Patterns of cancer incidence, mortality, and prevalence across five continents: defining priorities to reduce cancer disparities in different geographic regions of the world. J Clin Oncol 2006;24:2137–50 - PubMed
-
- Bang YJ, Van Cutsem E, Feyereislova A, et al. Trastuzumab in combination with chemotherapy versus chemotherapy alone for treatment of HER2-positive advanced gastric or gastro-oesophageal junction cancer (ToGA): a phase 3, open-label, randomised controlled trial. Lancet 2010;376:687–97 - PubMed
-
- Hofmann M, Stoss O, Shi D, et al. Assessment of a HER2 scoring system for gastric cancer: results from a validation study. Histopathology 2008;52:797–805 - PubMed
Publication types
MeSH terms
Substances
Associated data
- Actions
LinkOut - more resources
Full Text Sources
Other Literature Sources
Medical
Molecular Biology Databases
Research Materials
Miscellaneous
