Dissecting the regulatory architecture of gene expression QTLs
- PMID: 22293038
- PMCID: PMC3334587
- DOI: 10.1186/gb-2012-13-1-r7
Dissecting the regulatory architecture of gene expression QTLs
Abstract
Background: Expression quantitative trait loci (eQTLs) are likely to play an important role in the genetics of complex traits; however, their functional basis remains poorly understood. Using the HapMap lymphoblastoid cell lines, we combine 1000 Genomes genotypes and an extensive catalogue of human functional elements to investigate the biological mechanisms that eQTLs perturb.
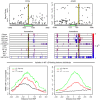
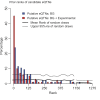
Results: We use a Bayesian hierarchical model to estimate the enrichment of eQTLs in a wide variety of regulatory annotations. We find that approximately 40% of eQTLs occur in open chromatin, and that they are particularly enriched in transcription factor binding sites, suggesting that many directly impact protein-DNA interactions. Analysis of core promoter regions shows that eQTLs also frequently disrupt some known core promoter motifs but, surprisingly, are not enriched in other well-known motifs such as the TATA box. We also show that information from regulatory annotations alone, when weighted by the hierarchical model, can provide a meaningful ranking of the SNPs that are most likely to drive gene expression variation.
Conclusions: Our study demonstrates how regulatory annotation and the association signal derived from eQTL-mapping can be combined into a single framework. We used this approach to further our understanding of the biology that drives human gene expression variation, and of the putatively causal SNPs that underlie it.
Figures


Similar articles
-
Integrative modeling of eQTLs and cis-regulatory elements suggests mechanisms underlying cell type specificity of eQTLs.PLoS Genet. 2013;9(8):e1003649. doi: 10.1371/journal.pgen.1003649. Epub 2013 Aug 1. PLoS Genet. 2013. PMID: 23935528 Free PMC article.
-
DNase I sensitivity QTLs are a major determinant of human expression variation.Nature. 2012 Feb 5;482(7385):390-4. doi: 10.1038/nature10808. Nature. 2012. PMID: 22307276 Free PMC article.
-
Principles of microRNA Regulation Revealed Through Modeling microRNA Expression Quantitative Trait Loci.Genetics. 2016 Aug;203(4):1629-40. doi: 10.1534/genetics.116.187153. Epub 2016 Jun 3. Genetics. 2016. PMID: 27260304 Free PMC article.
-
Expression Quantitative Trait Loci Information Improves Predictive Modeling of Disease Relevance of Non-Coding Genetic Variation.PLoS One. 2015 Oct 16;10(10):e0140758. doi: 10.1371/journal.pone.0140758. eCollection 2015. PLoS One. 2015. PMID: 26474488 Free PMC article. Review.
-
Expression quantitative trait loci: present and future.Philos Trans R Soc Lond B Biol Sci. 2013 May 6;368(1620):20120362. doi: 10.1098/rstb.2012.0362. Print 2013. Philos Trans R Soc Lond B Biol Sci. 2013. PMID: 23650636 Free PMC article. Review.
Cited by
-
Cross-population joint analysis of eQTLs: fine mapping and functional annotation.PLoS Genet. 2015 Apr 23;11(4):e1005176. doi: 10.1371/journal.pgen.1005176. eCollection 2015 Apr. PLoS Genet. 2015. PMID: 25906321 Free PMC article.
-
Allelic imbalance of chromatin accessibility in cancer identifies candidate causal risk variants and their mechanisms.Nat Genet. 2022 Jun;54(6):837-849. doi: 10.1038/s41588-022-01075-2. Epub 2022 Jun 13. Nat Genet. 2022. PMID: 35697866 Free PMC article.
-
Higher-order chromatin domains link eQTLs with the expression of far-away genes.Nucleic Acids Res. 2014 Jan;42(1):87-96. doi: 10.1093/nar/gkt857. Epub 2013 Oct 1. Nucleic Acids Res. 2014. PMID: 24089144 Free PMC article.
-
FIRE: functional inference of genetic variants that regulate gene expression.Bioinformatics. 2017 Dec 15;33(24):3895-3901. doi: 10.1093/bioinformatics/btx534. Bioinformatics. 2017. PMID: 28961785 Free PMC article.
-
Bayesian integration of genetics and epigenetics detects causal regulatory SNPs underlying expression variability.Nat Commun. 2015 Oct 12;6:8555. doi: 10.1038/ncomms9555. Nat Commun. 2015. PMID: 26456756 Free PMC article.
References
-
- Wray GA. The evolutionary significance of cis-regulatory mutations. Nat Rev Genet. 2007;8:206–216. - PubMed
-
- Emilsson V, Thorleifsson G, Zhang B, Leonardson AS, Zink F, Zhu J, Carlson S, Helgason A, Walters GB, Gunnarsdottir S, Mouy M, Steinthorsdottir V, Eiriksdottir GH, Bjornsdottir G, Reynisdottir I, Gudbjartsson D, Helgadottir A, Jonasdottir A, Jonasdottir A, Styrkarsdottir U, Gretarsdottir S, Magnusson KP, Stefansson H, Fossdal R, Kristjansson K, Gislason HG, Stefansson T, Leifsson BG, Thorsteinsdottir U, Lamb JR. et al.Genetics of gene expression and its effect on disease. Nature. 2008;452:423–U2. doi: 10.1038/nature06758. - DOI - PubMed
Publication types
MeSH terms
Substances
Grants and funding
LinkOut - more resources
Full Text Sources
Other Literature Sources

