Identification of new viral genes and transcript isoforms during Epstein-Barr virus reactivation using RNA-Seq
- PMID: 22090128
- PMCID: PMC3264377
- DOI: 10.1128/JVI.06537-11
Identification of new viral genes and transcript isoforms during Epstein-Barr virus reactivation using RNA-Seq
Abstract
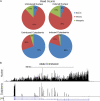
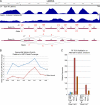
Using an enhanced RNA-Seq pipeline to analyze Epstein-Barr virus (EBV) transcriptomes, we investigated viral and cellular gene expression in the Akata cell line following B-cell-receptor-mediated reactivation. Robust induction of EBV gene expression was observed, with most viral genes induced >200-fold and with EBV transcripts accounting for 7% of all mapped reads within the cell. After induction, hundreds of candidate splicing events were detected using the junction mapper TopHat, including a novel nonproductive splicing event at the gp350/gp220 locus and several alternative splicing events at the LMP2 locus. A more detailed analysis of lytic LMP2 transcripts showed an overall lack of the prototypical type III latency splicing events. Analysis of nuclear versus cytoplasmic RNA-Seq data showed that the lytic forms of LMP2, EBNA-2, EBNA-LP, and EBNA-3A, -3B, and -3C have higher nuclear-to-cytoplasmic accumulation ratios than most lytic genes, including classic late genes. These data raise the possibility that at least some lytic transcripts derived from these latency gene loci may have unique, noncoding nuclear functions during reactivation. Our analysis also identified two previously unknown genes, BCLT1 and BCRT2, that map to the BamHI C-region of the EBV genome. Pathway analysis of cellular gene expression changes following B-cell receptor activation identified an inflammatory response as the top predicted function and ILK and TREM1 as the top predicted canonical pathways.
Figures


Similar articles
-
Global bidirectional transcription of the Epstein-Barr virus genome during reactivation.J Virol. 2014 Feb;88(3):1604-16. doi: 10.1128/JVI.02989-13. Epub 2013 Nov 20. J Virol. 2014. PMID: 24257595 Free PMC article.
-
Host Gene Expression Is Regulated by Two Types of Noncoding RNAs Transcribed from the Epstein-Barr Virus BamHI A Rightward Transcript Region.J Virol. 2015 Nov;89(22):11256-68. doi: 10.1128/JVI.01492-15. Epub 2015 Aug 26. J Virol. 2015. PMID: 26311882 Free PMC article.
-
Quantitative and qualitative RNA-Seq-based evaluation of Epstein-Barr virus transcription in type I latency Burkitt's lymphoma cells.J Virol. 2010 Dec;84(24):13053-8. doi: 10.1128/JVI.01521-10. Epub 2010 Oct 13. J Virol. 2010. PMID: 20943983 Free PMC article.
-
Epstein-Barr virus and Hodgkin's disease: transcriptional analysis of virus latency in the malignant cells.J Exp Med. 1993 Feb 1;177(2):339-49. doi: 10.1084/jem.177.2.339. J Exp Med. 1993. PMID: 8381153 Free PMC article.
-
EBNA-3B- and EBNA-3C-regulated cellular genes in Epstein-Barr virus-immortalized lymphoblastoid cell lines.J Virol. 2006 Oct;80(20):10139-50. doi: 10.1128/JVI.00854-06. J Virol. 2006. PMID: 17005691 Free PMC article.
Cited by
-
Global bidirectional transcription of the Epstein-Barr virus genome during reactivation.J Virol. 2014 Feb;88(3):1604-16. doi: 10.1128/JVI.02989-13. Epub 2013 Nov 20. J Virol. 2014. PMID: 24257595 Free PMC article.
-
Pervasive transcription of a herpesvirus genome generates functionally important RNAs.mBio. 2014 Mar 11;5(2):e01033-13. doi: 10.1128/mBio.01033-13. mBio. 2014. PMID: 24618256 Free PMC article.
-
MHC class I-associated peptides derive from selective regions of the human genome.J Clin Invest. 2016 Dec 1;126(12):4690-4701. doi: 10.1172/JCI88590. Epub 2016 Nov 14. J Clin Invest. 2016. PMID: 27841757 Free PMC article.
-
The BHLF1 Locus of Epstein-Barr Virus Contributes to Viral Latency and B-Cell Immortalization.J Virol. 2020 Aug 17;94(17):e01215-20. doi: 10.1128/JVI.01215-20. Print 2020 Aug 17. J Virol. 2020. PMID: 32581094 Free PMC article.
-
Identification of Epstein-Barr Virus Replication Proteins in Burkitt's Lymphoma Cells.Pathogens. 2015 Oct 29;4(4):739-51. doi: 10.3390/pathogens4040739. Pathogens. 2015. PMID: 26529022 Free PMC article.
References
-
- Bhende PM, Seaman WT, Delecluse HJ, Kenney SC. 2004. The EBV lytic switch protein, Z, preferentially binds to and activates the methylated viral genome. Nat. Genet. 36:1099–1104 - PubMed
-
- de Jesus O, et al. 2003. Updated Epstein-Barr virus (EBV) DNA sequence and analysis of a promoter for the BART (CST, BARF0) RNAs of EBV. J. Gen. Virol. 84:1443–1450 - PubMed
-
- Dolan A, Addison C, Gatherer D, Davison AJ, McGeoch DJ. 2006. The genome of Epstein-Barr virus type 2 strain AG876. Virology 350:164–170 - PubMed
Publication types
MeSH terms
Substances
Grants and funding
LinkOut - more resources
Full Text Sources

