. 2011 Jun;1(1):54-67.
doi: 10.1158/2159-8274.CD-10-0028. Epub 2011 Jun 1.

Leukocyte complexity predicts breast cancer survival and functionally regulates response to chemotherapy

Affiliations

Leukocyte complexity predicts breast cancer survival and functionally regulates response to chemotherapy

David G DeNardo et al. Cancer Discov. 2011 Jun.

Abstract

Immune-regulated pathways influence multiple aspects of cancer development. In this article we demonstrate that both macrophage abundance and T-cell abundance in breast cancer represent prognostic indicators for recurrence-free and overall survival. We provide evidence that response to chemotherapy is in part regulated by these leukocytes; cytotoxic therapies induce mammary epithelial cells to produce monocyte/macrophage recruitment factors, including colony stimulating factor 1 (CSF1) and interleukin-34, which together enhance CSF1 receptor (CSF1R)-dependent macrophage infiltration. Blockade of macrophage recruitment with CSF1R-signaling antagonists, in combination with paclitaxel, improved survival of mammary tumor-bearing mice by slowing primary tumor development and reducing pulmonary metastasis. These improved aspects of mammary carcinogenesis were accompanied by decreased vessel density and appearance of antitumor immune programs fostering tumor suppression in a CD8+ T-cell-dependent manner. These data provide a rationale for targeting macrophage recruitment/response pathways, notably CSF1R, in combination with cytotoxic therapy, and identification of a breast cancer population likely to benefit from this novel therapeutic approach.

Significance: These findings reveal that response to chemotherapy is in part regulated by the tumor immune microenvironment and that common cytotoxic drugs induce neoplastic cells to produce monocyte/macrophage recruitment factors, which in turn enhance macrophage infiltration into mammary adenocarcinomas. Blockade of pathways mediating macrophage recruitment, in combination with chemotherapy, significantly decreases primary tumor progression, reduces metastasis, and improves survival by CD8+ T-cell-dependent mechanisms, thus indicating that the immune microenvironment of tumors can be reprogrammed to instead foster antitumor immunity and improve response to cytotoxic therapy.


Conflict of interest statement

Disclosure of Potential Conflicts of Interest

E. Rexhepaj, D.J. Brennan, and W.M. Gallagher are inventors of a pending patent application in relation to the development of novel automated image analysis approaches in histopathology, and D.G. DeNardo, D.J. Brennan and L.M. Coussens are inventors of a pending patent application in relation to immune-based signatures for predicting breast cancer risk. B.L. West is an employee of Plexxikon Inc. but had no involvement in data collection, analysis, or interpretation.

Figures
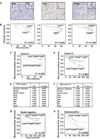
Figure 1
Figure 1
CD68/CD4/CD8 immune signature is an independent prognostic indicator of breast cancer survival. A, high-magnification images (40×; 80× for inlays) of human breast cancer tissue sections showing immunoreactivity for representative CD68+, CD4+, and CD8+ leukocyte infiltration. B, automated analysis of CD68+, CD4+, and CD8+ immune cell detection, revealing relationship between leukocyte density and OS. Kaplan-Meier estimate of OS comparing autoscore leukocyte high- and low-infiltration groups is shown; 179 samples from Cohort I were used for analyses, and log-rank (Mantel-Cox) P values are denoted for difference in OS. C and D, Kaplan-Meier estimate of RFS, comparing CD68high/CD4high/CD8low and CD68low/CD4low/CD8high immune profiles as assigned by random forest clustering to identify optimal thresholds using Cohort I (C). Identified CD68high/CD4high/CD8low and CD68low/CD4low/CD8high immune profiles were used to stratify a second independent cohort, Cohort II (D). Cohort I (n = 179) and Cohort II (n = 498) samples were assessed, and the log-rank (Mantel-Cox) P value is denoted for difference in RFS. E and F, results from multivariate Cox regression analysis of RFS for the CD68/CD4/CD8 signature in Cohort I (E) and Cohort II (F). Hazard ratios (HR) and P values are shown for all characteristics. G and H, RFS in node-positive breast cancer predicted by CD68/CD4/CD8 immune signature. Kaplan-Meier estimates of RFS comparing CD68high/CD4high/CD8low and CD68low/ CD4low/CD8high immune profiles as assigned by random forest clustering of breast cancer tissues. breast cancers were stratified into node-negative (G) and node-positive (H) patients and analyzed for RFS. The log-rank (Mantel-Cox) P is denoted for difference in RFS.
Figure 2
Figure 2
Cytotoxic therapy induces macrophage recruitment, as well as CSF1 and IL-34 mRNA expression. A, macrophage percentage in fresh human primary breast cancer tissues, depicted as mean of CD45+CD11b+CD14+ macrophages as a percentage of total cells (analyzed by flow cytometry). “Neo-adjuvant” denotes patients who received chemotherapy prior to surgical resection of their primary breast cancer, as opposed to those who did not, denoted as “untreated”; *, statistically significant differences (P = 0.004) between the 2 groups. B, PTX-induced CSF1 mRNA expression regulates tumor infiltration of macrophages and limits PTX response. (i), TAM percentage in mammary tumors of MMTV-PyMT mice following PTX treatment with mean number of CD45+Ly6GLy6CCD11b+F4/80+ TAMs as a percentage of total cells shown (analyzed by flow cytometry); (ii), primary tumor growth reduced by treatment with PTX. The 85-day-old MMTV-PyMT mice were treated with PTX and total tumor burden per animal was assessed every 5 days until endpoint. Treatment schematic is depicted at top, and data are displayed as mean tumor burden ±SEM; *, statistically significant differences between controls and PTX-treated mice (>8 mice/group). C, expression of monocyte/macrophage chemoattractants following chemotherapy. Quantitative reverse transcriptase PCR (qRT-PCR) analyses of CSF1, MCP1, MCP2, MCP3, and IL34 expression in MMTV-pMECs–derived MECs treated with PTX for 24 hours ex vivo, expressed as mean fold change, compared with controls. Samples were assayed in triplicate for each tested condition; *, statistically significant differences between control and PTX-treated groups. D, Dose-dependent expression of CSF1 following chemotherapy or radiation therapy. qRT-PCR analysis of mRNA expression in MMTV-PyMT–derived pMECs 24 hours after treatment with either cisplatin (CDDP), PTX, or a single dose of ionizing radiation, expressed as mean fold change, compared with control ±SEM. Drug and radiation doses are shown. Samples were assayed in triplicate for each tested condition; *, statistically significant differences between control and the indicated treatment. E, CSF1 expression induced by chemotherapy in human breast carcinoma cell lines. qRT-PCR analysis of mRNA expression in BT474, MDA-MB-435, SKBR3, T47D, MCF7, and MDA-MB-231 at 24 hours after treatment with either CDDP or PTX, expressed as mean fold change, compared with vehicle-treated cells ±SEM. Chemotherapeutic doses are denoted. Samples were assayed in triplicate for each condition; *, statistically significant differences between control and indicated treatment. F, CSF1 expression induced by cytotoxic therapy in MMTV-PyMT mammary tumors. qRT-PCR analysis of mRNA expression isolated from normal mammary tissue or MMTV-PyMT mammary tumors from mice treated with either PTX (10 mg/kg) every 5 days, or ionizing radiation (single dose of 8 Gy), expressed as mean fold change, compared with vehicle-treated tumors (4 mice/group). SE is depicted; *, statistically significant differences (P < 0.05, Mann-Whitney) for all gene expression analyses (C–F).
Figure 3
Figure 3
Cytotoxic therapy induces CSF1-dependent macrophage recruitment. A, analysis of TAM depletion following CSF1/CSF1R blockade. Mice bearing 1.0-cm orthotopic PyMT-derived tumors were treated either with αCSF1 or αCD11b neutralizing immunoglobulins (Ig) or with PLX3397. Treatment regimen is shown, and flow cytometric analysis of tumor-infiltrating D45+Ly6GLy6ClowCD11b+F4/80+ macrophages and CD45+CD11b+Ly6Ghigh iMCs is depicted as mean percentage of total cells ±SEM. B, selective depletion of TAMs following CSF1R kinase blockade. MMTV-PyMT mice (either 80 or 84 days old) were treated with PLX3397 for 4 or 8 days. Treatment regimen is shown, and flow cytometric analysis of tumor-infiltrating CD45+Ly6GLy6ClowCD11b+F4/80+ TAMs, CD45+Ly6GLy6ClowCD11blow/− CD11chighMHCIIHi DCs, and CD45+CD11b+Ly6GHi iMCs in mammary tumors is depicted as mean percentage of total cells ±SEM. C, perivascular TAMs resisting PLX3397. Representative images of F4/80+ cell staining of mammary tumors from 90-day-old MMTV-PyMT mice treated with PLX3397 (vs control) for 8 days. Insets (a and b) show F4/80 staining in tumor stroma and tumor interior; (i), costaining for F4/80 (red) and CD31 (green); scale bar, 500 µm, 100 µm (a and b); 25 µm (i). D, peripheral blood lymphocyte (PBL) migration in response to conditioned medium from MMTV-PyMT MECs treated with either vehicle or PTX (25 nM for 24 hours), evaluated by Boyden chamber assay. CD45+CD11b+ peripheral blood monocytes after migration to the lower chamber, in the presence or absence of PLX3397 (50 nM), as quantified by flow cytometry. Data are depicted as mean cell number assayed in triplicate. E, PTX-induced TAM recruitment inhibited by PLX3397. TAM density in mammary tumors removed from MMTV-PyMT mice following treatment with PTX ± PLX3397. * Treatment regimen is shown with mouse age, and data are depicted as mean number of CD45+Ly6GLy6CCD11b+F4/80+ TAMs as a percentage of total cells ±SEM (analyzed by flow cytometry, >5 mice/group). Representative IHC staining for F4/80 (red) and nuclear DNA (blue) from the same cohort of animals is shown. Scale bar, 500 µm; *, statistically significant differences (P < 0.05, Mann-Whitney) in A–E.
Figure 4
Figure 4
Macrophage depletion improves response to chemotherapy. A and B, primary tumor growth reduced by treatment with macrophage-depleting agents in combination with chemotherapy. Orthotopic PyMT-derived tumors were grown to a median diameter of 1.0 cm, and mice were then treated with PTX, CBDCA, and/or αCSF1, αCD11b neutralizing Igs ± PLX3397 for 21 or 28 days, with total tumor burden per animal assessed every 2 to 3 days. Treatment regimens are depicted for all cohorts, and data displayed as mean tumor burden ±SEM; *, statistically significant differences between vehicle- and PTX-treated mice. **, significant differences between mice treated with PTX alone and mice treated with PTX/PLX3397 or αCSF1 or αCD11b in combination. C, histologic stage analysis of MMTV-PyMT tumors. Tumors from 100-day-old MMTV-PyMT mice treated with PTX or PLX3397 or both were assessed for the presence of premalignant tissue and early- and late-stage carcinoma; data expressed as mean percentage of total gland area ± SEM. D, quantification of cleaved caspase-3–positive cells in mammary tumors of MMTV-PyMT mice treated with PTX or PLX3397 or both versus control (vehicle). Graph depicts mean positive cells per µm2 of tumor tissue. Representative images show cleaved caspase-3–positive cells (brown staining) in tumors of MMTV-PyMT mice; scale bar, 500 µm. E, VEGF mRNA expression assessed by qRT-PCR of tumor tissue from MMTV-PyMT mice treated with vehicle or PTX or PLX3397 or both. Graph depicts mean fold change in gene expression compared with vehicle-treated control group. F, quantification of CD31– positive vessels in mammary tumors from MMTV-PyMT mice treated with PTX or PLX3397 or both, versus control (vehicle). Data represent the mean number of CD31+ positive vessels per mm2 of carcinoma tissue. Representative photomicrographs show CD31-positive vessels (brown staining); scale bar, 400 µm; *, statistically significant differences (P < 0.05, Mann-Whitney) in C–F.
Figure 5
Figure 5
PTX in combination with PLX397 induces antitumor T-cell response. A and B, tumor infiltration by T lymphocytes enhanced by combined PTX and CSF1 or CSF1R blockade. Flow cytometric analyses of tumor infiltrating CD3+CD8+ and CD3+CD4+ T lymphocytes depicted as the mean number of positive cells, assessed as a percentage of total cells following treatment of MMTV-PyMT mice with PTX or PLX3397 or both (A), or treatment of mice having orthotopic PyMT-derived tumors with combined PTX/αCSF1 or PTX/PLX3397 (B), compared with controls. Mean values ±SEM are depicted. C, cytokine mRNA expression assessed in orthotopic PyMT-derived tumors from mice treated with PTX alone or in combination with PLX3397. Graph depicts mean fold change in mRNA expression compared with PTX treatment group (5 animals/group). SEM is depicted. D, tumor infiltration by DCs enhanced by combined PTX/PLX3397. Flow cytometric analysis of tumor-infiltrating CD45+Ly6GLy6ClowCD11blow/−CD11chighMHCIIhigh DCs depicted as mean percentage of positive cells as a percentage of total cells from MMTV-PyMT mice treated with PTX or PLX3397 or both, versus controls. E, CD8+ T-lymphocyte activation repressed by TAMs. Purified T cells were loaded with CFSE and activated in vitro by plate-bound CD3/28 and cocultured with the indicated ratio of CD45+Ly6GLy6CLow CD11b+F4/80+ TAMs isolated from late-stage mammary tumors of MMTV-PyMT mice. Data are depicted as the percentage of live CD8+ T lymphocytes exhibiting CFSE dilution after 60 hours. Data are representative of 2 independent experiments run in triplicate. Error bars represent SEM. F, analysis of the ratio of tumor-infiltrating CD45+Ly6GLy6ClowCD11b+F4/80+ TAMs to CD3+CD8+ T lymphocytes depicted as mean ratio (TAM/CD8 CTL) ±SEM from MMTV-PyMT mice treated with vehicle or with PTX and/or PLX3397. *, statistically significant differences (P < 0.05, Mann-Whitney) in A–F. **, statistically significant differences (P < 0.05, Mann-Whitney) between PLX3397-treated groups in F.
Figure 6
Figure 6
Combined PLX3397 and PTX treatment inhibits metastasis in a CD8-dependent manner. A and B, improved outcome following PLX3397/PTX treatment dependent on CD8+ T cells. A, 85-day-old MMTV-PyMT mice were treated with PTX or PLX3397 or both, as well as anti-CD8 IgG. Total tumor burden per animal was assessed every 5 days. B, orthotopic PyMT-derived tumors were grown to a median diameter of 1.0 cm, at which time mice were treated with PTX or PLX3397 or both in combination with anti-CD8 or control IgG for 21 days, and total tumor burden per animal was assessed every 2 to 3 days. Treatment regimens are depicted along with SEM; *, statistically significant differences between mice treated with PTX alone and those treated with PLX3397/PTX. **, significant differences between mice treated with PLX3397/PTX and those treated with anti-CD8 and PTX/PLX3397/control IgG. C, histologic stage analysis of MMTV-PyMT tumors. Tumors from 100-day-old MMTV-PyMT mice treated with anti-CD8 IgG or with PTX and/or PLX3397 were assessed for presence of premalignant tissue and early- and late-stage carcinoma; data expressed as mean percentage of total gland area ±SEM. D, quantification of cleaved caspase-3–positive cells in mammary tumors of MMTV-PyMT mice treated with anti-CD8 IgG or with PTX and/or PLX3397 versus control (vehicle). Graph depicts mean positive cells per µm2 of tumor tissue. E, quantification of metastatic foci per lung section per mouse from 100-day-old MMTV-PyMT mice treated with PTX and/or PLX3397 and/or anti-CD8 IgG, versus controls. Each lung was serially sectioned, 6 sections 100 µm apart were stained with hematoxylin and eosin (H&E), and the total number of metastatic foci (>8 cells) was quantified per mouse (n ≥10 mice per cohort). SEM is depicted. *, Statistically significant differences (P < 0.05, Mann-Whitney). Representative photomicrographs of lung tissue sections reveal metastatic foci from 100-dayold MMTV-PyMT mice treated with vehicle or with PTX and/or PLX3397. Scale bar, 500 µm.
Figure 7
Figure 7
Ratio of CD68 to CD8 predicts patient survival and response to neoadjuvant chemotherapy. A, frequency of pCR in a cohort of 311 patients constructed from 2 independent datasets. All patients received FNAs prior to neoadjuvant chemotherapy and pathologic response was assessed at definitive surgery. With median expression as a threshold, examination of CD8a and CD68 mRNA in FNA samples revealed 3 separate groups: CD68 > CD8, CD68 < CD8, and CD68 = CD8 (denoted CD68high/CD8low, CD68low/CD8high, and CD68/CD8equal, respectively). Analysis of the rate of pCR in the groups is shown. B, Kaplan-Meier estimate of survival, comparing CD68high/CD8low and CD68low/CD8high immune profiles as assessed by mRNA expression from 3,872 patient samples assembled from 14 different platforms. Median expression for both CD8 and CD68 was used to determine high and low groups within each of the 22 individual datasets. Once a sample was assigned to a particular group, the 22 datasets were combined and a global survival analysis was performed. The log-rank (Mantel-Cox) P value is shown for difference in survival. C, Kaplan-Meier estimate of survival, comparing CD68high/CD8low and CD68low/CD8high immune profiles as assessed by mRNA expression from 3872 patient samples for tumors stratified into basal and HER2+ breast cancer. The log-rank (Mantel-Cox) P value is shown for difference in survival.

Similar articles

Cited by

References

    1. Pollard JW. Trophic macrophages in development and disease. Nat Rev Immunol. 2009;9:259–270. - PMC - PubMed
    1. Qian BZ, Pollard JW. Macrophage diversity enhances tumor progression and metastasis. Cell. 2010;141:39–51. - PMC - PubMed
    1. Tang R, Beuvon F, Ojeda M, Mosseri V, Pouillart P, Scholl S. M-CSF (monocyte colony stimulating factor) and M-CSF receptor expression by breast tumour cells: M-CSF mediated recruitment of tumour infiltrating monocytes? J Cell Biochem. 1992;50:350–356. - PubMed
    1. Wei S, Nandi S, Chitu V, Yeung YG, Yu W, Huang M, et al. Functional overlap but differential expression of CSF-1 and IL-34 in their CSF-1 receptor-mediated regulation of myeloid cells. J Leukoc Biol. 2010;88:495–505. - PMC - PubMed
    1. Campbell MJ, Tonlaar NY, Garwood ER, Huo D, Moore DH, Khramtsov AI, et al. Proliferating macrophages associated with high grade, hormone receptor negative breast cancer and poor clinical outcome. Breast Cancer Res Treat. 2010 [Epub ahead of print]. - PMC - PubMed

Publication types

MeSH terms

Substances