Magnetic susceptibility anisotropy of human brain in vivo and its molecular underpinnings
- PMID: 22036681
- PMCID: PMC3254777
- DOI: 10.1016/j.neuroimage.2011.10.038
Magnetic susceptibility anisotropy of human brain in vivo and its molecular underpinnings
Abstract
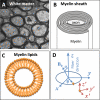
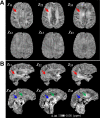
Frequency shift of gradient-echo MRI provides valuable information for assessing brain tissues. Recent studies suggest that the frequency and susceptibility contrast depend on white matter fiber orientation. However, the molecular underpinning of the orientation dependence is unclear. In this study, we investigated the orientation dependence of susceptibility of human brain in vivo and mouse brains ex vivo. The source of susceptibility anisotropy in white matter is likely to be myelin as evidenced by the loss of anisotropy in the dysmyelinating shiverer mouse brain. A biophysical model is developed to investigate the effect of the molecular susceptibility anisotropy of myelin components, especially myelin lipids, on the bulk anisotropy observed by MRI. This model provides a consistent interpretation of the orientation dependence of macroscopic magnetic susceptibility in normal mouse brain ex vivo and human brain in vivo and the microscopic origin of anisotropic susceptibility. It is predicted by the theoretical model and illustrated by the experimental data that the magnetic susceptibility of the white matter is least diamagnetic along the fiber direction. This relationship allows an efficient extraction of fiber orientation using susceptibility tensor imaging. These results suggest that anisotropy on the molecular level can be observed on the macroscopic level when the molecules are aligned in a highly ordered manner. Similar to the utilization of magnetic susceptibility anisotropy in elucidating molecular structures, imaging magnetic susceptibility anisotropy may also provide a useful tool for elucidating the microstructure of ordered biological tissues.
Copyright © 2011 Elsevier Inc. All rights reserved.
Figures


Similar articles
-
High-field (9.4 T) MRI of brain dysmyelination by quantitative mapping of magnetic susceptibility.Neuroimage. 2011 Jun 1;56(3):930-8. doi: 10.1016/j.neuroimage.2011.02.024. Epub 2011 Feb 12. Neuroimage. 2011. PMID: 21320606 Free PMC article.
-
Susceptibility tensor imaging (STI) of the brain.NMR Biomed. 2017 Apr;30(4):10.1002/nbm.3540. doi: 10.1002/nbm.3540. Epub 2016 Apr 27. NMR Biomed. 2017. PMID: 27120169 Free PMC article. Review.
-
MR susceptibility imaging.J Magn Reson. 2013 Apr;229:198-207. doi: 10.1016/j.jmr.2012.11.013. Epub 2012 Nov 29. J Magn Reson. 2013. PMID: 23273840 Free PMC article.
-
Mechanisms of T2 * anisotropy and gradient echo myelin water imaging.NMR Biomed. 2017 Apr;30(4). doi: 10.1002/nbm.3513. Epub 2016 Apr 7. NMR Biomed. 2017. PMID: 27060968 Review.
-
Quantitative magnetic susceptibility of the developing mouse brain reveals microstructural changes in the white matter.Neuroimage. 2014 Mar;88:134-42. doi: 10.1016/j.neuroimage.2013.11.026. Epub 2013 Nov 22. Neuroimage. 2014. PMID: 24269576 Free PMC article.
Cited by
-
Joint eigenvector estimation from mutually anisotropic tensors improves susceptibility tensor imaging of the brain, kidney, and heart.Magn Reson Med. 2017 Jun;77(6):2331-2346. doi: 10.1002/mrm.26321. Epub 2016 Jul 6. Magn Reson Med. 2017. PMID: 27385561 Free PMC article.
-
Learn Less, Infer More: Learning in the Fourier Domain for Quantitative Susceptibility Mapping.Front Neurosci. 2022 Feb 16;16:837721. doi: 10.3389/fnins.2022.837721. eCollection 2022. Front Neurosci. 2022. PMID: 35250469 Free PMC article.
-
In vivo quantitative susceptibility mapping (QSM) in Alzheimer's disease.PLoS One. 2013 Nov 21;8(11):e81093. doi: 10.1371/journal.pone.0081093. eCollection 2013. PLoS One. 2013. PMID: 24278382 Free PMC article.
-
Untangling the R2* contrast in multiple sclerosis: A combined MRI-histology study at 7.0 Tesla.PLoS One. 2018 Mar 21;13(3):e0193839. doi: 10.1371/journal.pone.0193839. eCollection 2018. PLoS One. 2018. PMID: 29561895 Free PMC article.
-
High-Resolution MR Imaging of the Human Brainstem In vivo at 7 Tesla.Front Hum Neurosci. 2013 Oct 29;7:710. doi: 10.3389/fnhum.2013.00710. eCollection 2013. Front Hum Neurosci. 2013. PMID: 24194710 Free PMC article.
References
-
- Baumann N, Pham-Dinh D. Biology of oligodendrocyte and myelin in the mammalian central nervous system. Physiol Rev. 2001;81:871–927. - PubMed
-
- Beaulieu C. The basis of anisotropic water diffusion in the nervous system - a technical review. NMR in Biomedicine. 2002;15:435–455. - PubMed
-
- Bertini I, Luchinat C, Parigi G. Magnetic susceptibility in paramagnetic NMR. Prog Nucl Mag Res Sp. 2002;40:249–273.
Publication types
MeSH terms
Substances
Grants and funding
LinkOut - more resources
Full Text Sources
Other Literature Sources
Medical

