The impact of a consortium of fermented milk strains on the gut microbiome of gnotobiotic mice and monozygotic twins
- PMID: 22030749
- PMCID: PMC3303609
- DOI: 10.1126/scitranslmed.3002701
The impact of a consortium of fermented milk strains on the gut microbiome of gnotobiotic mice and monozygotic twins
Abstract
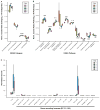
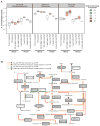
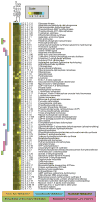
Understanding how the human gut microbiota and host are affected by probiotic bacterial strains requires carefully controlled studies in humans and in mouse models of the gut ecosystem where potentially confounding variables that are difficult to control in humans can be constrained. Therefore, we characterized the fecal microbiomes and metatranscriptomes of adult female monozygotic twin pairs through repeated sampling 4 weeks before, 7 weeks during, and 4 weeks after consumption of a commercially available fermented milk product (FMP) containing a consortium of Bifidobacterium animalis subsp. lactis, two strains of Lactobacillus delbrueckii subsp. bulgaricus, Lactococcus lactis subsp. cremoris, and Streptococcus thermophilus. In addition, gnotobiotic mice harboring a 15-species model human gut microbiota whose genomes contain 58,399 known or predicted protein-coding genes were studied before and after gavage with all five sequenced FMP strains. No significant changes in bacterial species composition or in the proportional representation of genes encoding known enzymes were observed in the feces of humans consuming the FMP. Only minimal changes in microbiota configuration were noted in mice after single or repeated gavage with the FMP consortium. However, RNA-Seq analysis of fecal samples and follow-up mass spectrometry of urinary metabolites disclosed that introducing the FMP strains into mice results in significant changes in expression of microbiome-encoded enzymes involved in numerous metabolic pathways, most prominently those related to carbohydrate metabolism. B. animalis subsp. lactis, the dominant persistent member of the FMP consortium in gnotobiotic mice, up-regulates a locus in vivo that is involved in the catabolism of xylooligosaccharides, a class of glycans widely distributed in fruits, vegetables, and other foods, underscoring the importance of these sugars to this bacterial species. The human fecal metatranscriptome exhibited significant changes, confined to the period of FMP consumption, that mirror changes in gnotobiotic mice, including those related to plant polysaccharide metabolism. These experiments illustrate a translational research pipeline for characterizing the effects of FMPs on the human gut microbiome.
Conflict of interest statement
Competing interests: The authors declare that they have no competing interests.
Figures


Comment in
-
Unraveling how probiotic yogurt works.Sci Transl Med. 2011 Oct 26;3(106):106ps41. doi: 10.1126/scitranslmed.3003291. Sci Transl Med. 2011. PMID: 22030747
Similar articles
-
Effects of synbiotic fermented milk containing Lactobacillus acidophilus La-5 and Bifidobacterium animalis ssp. lactis BB-12 on the fecal microbiota of adults with irritable bowel syndrome: A randomized double-blind, placebo-controlled trial.J Dairy Sci. 2016 Jul;99(7):5008-5021. doi: 10.3168/jds.2015-10743. Epub 2016 May 4. J Dairy Sci. 2016. PMID: 27157575 Clinical Trial.
-
Human gut metatranscriptome changes induced by a fermented milk product are associated with improved tolerance to a flatulogenic diet.Comput Struct Biotechnol J. 2022 Apr 5;20:1632-1641. doi: 10.1016/j.csbj.2022.04.001. eCollection 2022. Comput Struct Biotechnol J. 2022. PMID: 35465165 Free PMC article.
-
Metagenome-assembled genomes for biomarkers of bio-functionalities in Laal dahi, an Indian ethnic fermented milk product.Int J Food Microbiol. 2023 Oct 2;402:110300. doi: 10.1016/j.ijfoodmicro.2023.110300. Epub 2023 Jun 22. Int J Food Microbiol. 2023. PMID: 37364321
-
Immunology and probiotic impact of the newborn and young children intestinal microflora.Anaerobe. 2011 Dec;17(6):369-74. doi: 10.1016/j.anaerobe.2011.03.010. Epub 2011 Apr 16. Anaerobe. 2011. PMID: 21515397 Review.
-
Unravelling the effects of the environment and host genotype on the gut microbiome.Nat Rev Microbiol. 2011 Apr;9(4):279-90. doi: 10.1038/nrmicro2540. Nat Rev Microbiol. 2011. PMID: 21407244 Review.
Cited by
-
Translational activity is uncoupled from nucleic acid content in bacterial cells of the human gut microbiota.Gut Microbes. 2021 Jan-Dec;13(1):1-15. doi: 10.1080/19490976.2021.1903289. Gut Microbes. 2021. PMID: 33779505 Free PMC article.
-
Replenishing our defensive microbes.Bioessays. 2013 Sep;35(9):810-7. doi: 10.1002/bies.201300018. Epub 2013 Jul 8. Bioessays. 2013. PMID: 23836415 Free PMC article. Review.
-
How informative is the mouse for human gut microbiota research?Dis Model Mech. 2015 Jan;8(1):1-16. doi: 10.1242/dmm.017400. Dis Model Mech. 2015. PMID: 25561744 Free PMC article. Review.
-
Faecal Metaproteomic Analysis Reveals a Personalized and Stable Functional Microbiome and Limited Effects of a Probiotic Intervention in Adults.PLoS One. 2016 Apr 12;11(4):e0153294. doi: 10.1371/journal.pone.0153294. eCollection 2016. PLoS One. 2016. PMID: 27070903 Free PMC article. Clinical Trial.
-
The human microbiome: at the interface of health and disease.Nat Rev Genet. 2012 Mar 13;13(4):260-70. doi: 10.1038/nrg3182. Nat Rev Genet. 2012. PMID: 22411464 Free PMC article. Review.
References
-
- Qin J, Li R, Raes J, Arumugam M, Burgdorf KS, Manichanh C, Nielsen T, Pons N, Levenez F, Yamada T, Mende DR, Li J, Xu J, Li S, Li D, Cao J, Wang B, Liang H, Zheng H, Xie Y, Tap J, Lepage P, Bertalan M, Batto JM, Hansen T, Le Paslier D, Linneberg A, Nielsen HB, Pelletier E, Renault P, Sicheritz-Ponten T, Turner K, Zhu H, Yu C, Jian M, Zhou Y, Li Y, Zhang X, Qin N, Yang H, Wang J, Brunak S, Dore J, Guarner F, Kristiansen K, Pedersen O, Parkhill J, Weissenbach J, Bork P, Ehrlich SD. A human gut microbial gene catalogue established by metagenomic sequencing. Nature. 2010;464:59. - PMC - PubMed
-
- Kurokawa K, Itoh T, Kuwahara T, Oshima K, Toh H, Toyoda A, Takami H, Morita H, Sharma VK, Srivastava TP, Taylor TD, Noguchi H, Mori H, Ogura Y, Ehrlich DS, Itoh K, Takagi T, Sakaki Y, Hayashi T, Hattori M. Comparative metagenomics revealed commonly enriched gene sets in human gut microbiomes. DNA Res. 2007;14:169. - PMC - PubMed
-
- Arumugam M, Raes J, Pelletier E, Le Paslier D, Yamada T, Mende DR, Fernandes GR, Tap J, Bruls T, Batto JM, Bertalan M, Borruel N, Casellas F, Fernandez L, Gautier L, Hansen T, Hattori M, Hayashi T, Kleerebezem M, Kurokawa K, Leclerc M, Levenez F, Manichanh C, Nielsen HB, Nielsen T, Pons N, Poulain J, Qin J, Sicheritz-Ponten T, Tims S, Torrents D, Ugarte E, Zoetendal EG, Wang J, Guarner F, Pedersen O, de Vos WM, Brunak S, Dore J, Antolin M, Artiguenave F, Blottiere HM, Almeida M, Brechot C, Cara C, Chervaux C, Cultrone A, Delorme C, Denariaz G, Dervyn R, Foerstner KU, Friss C, van de Guchte M, Guedon E, Haimet F, Huber W, van Hylckama-Vlieg J, Jamet A, Juste C, Kaci G, Knol J, Lakhdari O, Layec S, Le Roux K, Maguin E, Merieux A, Melo Minardi R, M’Rini C, Muller J, Oozeer R, Parkhill J, Renault P, Rescigno M, Sanchez N, Sunagawa S, Torrejon A, Turner K, Vandemeulebrouck G, Varela E, Winogradsky Y, Zeller G, Weissenbach J, Ehrlich SD, Bork P. Enterotypes of the human gut microbiome. Nature. 2011;473:174. - PMC - PubMed
Publication types
MeSH terms
Associated data
- Actions
- Actions
- Actions
- Actions
- Actions
- Actions
Grants and funding
- AA09022/AA/NIAAA NIH HHS/United States
- K05 AA017688/AA/NIAAA NIH HHS/United States
- R01 DK070977/DK/NIDDK NIH HHS/United States
- R01 AA009022/AA/NIAAA NIH HHS/United States
- K01 DK090285/DK/NIDDK NIH HHS/United States
- DK30292/DK/NIDDK NIH HHS/United States
- DK078669/DK/NIDDK NIH HHS/United States
- AA17915/AA/NIAAA NIH HHS/United States
- AA11998/AA/NIAAA NIH HHS/United States
- DK70977/DK/NIDDK NIH HHS/United States
- R01 AA017915/AA/NIAAA NIH HHS/United States
- R37 DK030292-31/DK/NIDDK NIH HHS/United States
- R37 DK030292/DK/NIDDK NIH HHS/United States
- R01 DK030292/DK/NIDDK NIH HHS/United States
- P50 AA011998/AA/NIAAA NIH HHS/United States
- HD49024/HD/NICHD NIH HHS/United States
- P30 AG028716/AG/NIA NIH HHS/United States
- R01 DK070977-08/DK/NIDDK NIH HHS/United States
- R01 HD049024/HD/NICHD NIH HHS/United States
LinkOut - more resources
Full Text Sources
Other Literature Sources
Molecular Biology Databases

