Opposing signals from the Bcl6 transcription factor and the interleukin-2 receptor generate T helper 1 central and effector memory cells
- PMID: 22018468
- PMCID: PMC3208313
- DOI: 10.1016/j.immuni.2011.09.009
Opposing signals from the Bcl6 transcription factor and the interleukin-2 receptor generate T helper 1 central and effector memory cells
Abstract
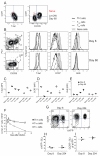
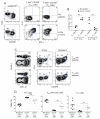
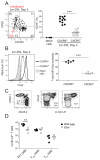
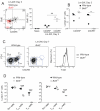
Listeria monocytogenes infection generates T helper 1 (Th1) effector memory cells and CC chemokine receptor 7 (CCR7)(+) cells resembling central memory cells. We tracked endogenous L. monocytogenes-specific CD4(+) T cells to determine how these memory cells are formed. Two effector cell populations were already present several days after infection. One highly expressed the T-bet transcription factor and produced Th1 memory cells in an interleukin-2 (IL-2) receptor-dependent fashion. The other resided in the T cell areas, expressed CCR7 and CXC chemokine receptor 5 (CXCR5), and like follicular helper cells depended on the Bcl6 transcription factor and inducible costimulator ligand on B cells. The CCR7(+)CXCR5(+) effector cells produced similar memory cells that generated diverse effector cell populations in a secondary response. Thus, Th1 effector memory and follicular helper-like central memory cells are produced from early effector cell populations that diverge in response to signals from the IL-2 receptor, Bcl6, and B cells.
Copyright © 2011 Elsevier Inc. All rights reserved.
Figures


Comment in
-
Memory: the incomplete unhappening of differentiation.Immunity. 2011 Oct 28;35(4):496-8. doi: 10.1016/j.immuni.2011.10.001. Immunity. 2011. PMID: 22035843
Similar articles
-
ICOS receptor instructs T follicular helper cell versus effector cell differentiation via induction of the transcriptional repressor Bcl6.Immunity. 2011 Jun 24;34(6):932-46. doi: 10.1016/j.immuni.2011.03.023. Immunity. 2011. PMID: 21636296 Free PMC article.
-
Circulating precursor CCR7(lo)PD-1(hi) CXCR5⁺ CD4⁺ T cells indicate Tfh cell activity and promote antibody responses upon antigen reexposure.Immunity. 2013 Oct 17;39(4):770-81. doi: 10.1016/j.immuni.2013.09.007. Immunity. 2013. PMID: 24138884
-
Bcl6 and Maf cooperate to instruct human follicular helper CD4 T cell differentiation.J Immunol. 2012 Apr 15;188(8):3734-44. doi: 10.4049/jimmunol.1103246. Epub 2012 Mar 16. J Immunol. 2012. PMID: 22427637 Free PMC article.
-
Chemokine-mediated control of T cell traffic in lymphoid and peripheral tissues.Mol Immunol. 2005 May;42(7):799-809. doi: 10.1016/j.molimm.2004.06.040. Epub 2004 Nov 23. Mol Immunol. 2005. PMID: 15829268 Review.
-
Development and function of follicular helper T cells.Biosci Biotechnol Biochem. 2016;80(1):1-6. doi: 10.1080/09168451.2015.1056512. Epub 2015 Jun 29. Biosci Biotechnol Biochem. 2016. PMID: 26120879 Review.
Cited by
-
T follicular helper cell programming by cytokine-mediated events.Immunology. 2016 Nov;149(3):253-261. doi: 10.1111/imm.12648. Epub 2016 Aug 16. Immunology. 2016. PMID: 27442976 Free PMC article. Review.
-
Cutting edge: lymphoid tissue inducer cells maintain memory CD4 T cells within secondary lymphoid tissue.J Immunol. 2012 Sep 1;189(5):2094-8. doi: 10.4049/jimmunol.1201639. Epub 2012 Aug 1. J Immunol. 2012. PMID: 22855716 Free PMC article.
-
The unique features of follicular T cell subsets.Cell Mol Life Sci. 2013 Dec;70(24):4771-84. doi: 10.1007/s00018-013-1420-3. Epub 2013 Jul 14. Cell Mol Life Sci. 2013. PMID: 23852544 Free PMC article. Review.
-
OCA-B/Pou2af1 is sufficient to promote CD4+ T cell memory and prospectively identifies memory precursors.Proc Natl Acad Sci U S A. 2024 Feb 27;121(9):e2309153121. doi: 10.1073/pnas.2309153121. Epub 2024 Feb 22. Proc Natl Acad Sci U S A. 2024. PMID: 38386711 Free PMC article.
-
Cutting edge: Bcl6-interacting corepressor contributes to germinal center T follicular helper cell formation and B cell helper function.J Immunol. 2015 Jun 15;194(12):5604-8. doi: 10.4049/jimmunol.1500201. Epub 2015 May 11. J Immunol. 2015. PMID: 25964495 Free PMC article.
References
-
- Ahmed R, Gray D. Immunological memory and protective immunity: understanding their relation. Science. 1996;272:54–60. - PubMed
-
- Akiba H, Takeda K, Kojima Y, Usui Y, Harada N, Yamazaki T, Ma J, Tezuka K, Yagita H, Okumura K. The role of ICOS in the CXCR5+ follicular B helper T cell maintenance in vivo. J. Immunol. 2005;175:2340–2348. - PubMed
-
- Chang JT, Palanivel VR, Kinjyo I, Schambach F, Intlekofer AM, Banerjee A, Longworth SA, Vinup KE, Mrass P, Oliaro J, et al. Asymmetric T lymphocyte division in the initiation of adaptive immune responses. Science. 2007;315:1687–1691. - PubMed
Publication types
MeSH terms
Substances
Grants and funding
- R01 AI039614-16/AI/NIAID NIH HHS/United States
- T32 AI007313/AI/NIAID NIH HHS/United States
- R01 AI066018/AI/NIAID NIH HHS/United States
- R37-AI27998/AI/NIAID NIH HHS/United States
- R01-AI66018/AI/NIAID NIH HHS/United States
- R01 AI039614/AI/NIAID NIH HHS/United States
- R37 AI027998/AI/NIAID NIH HHS/United States
- R01 AR056632/AR/NIAMS NIH HHS/United States
- R01 AI066018-05/AI/NIAID NIH HHS/United States
- T32 CA009138/CA/NCI NIH HHS/United States
- T32-AI07313/AI/NIAID NIH HHS/United States
- R37 AI027998-23/AI/NIAID NIH HHS/United States
- R01-AR056632/AR/NIAMS NIH HHS/United States
- R01-AI39614/AI/NIAID NIH HHS/United States
LinkOut - more resources
Full Text Sources
Other Literature Sources
Molecular Biology Databases
Research Materials

