. 2012 Jan;91(1):167-81.
doi: 10.1189/jlb.0311177. Epub 2011 Sep 27.

Characterization of the nature of granulocytic myeloid-derived suppressor cells in tumor-bearing mice

Affiliations

Characterization of the nature of granulocytic myeloid-derived suppressor cells in tumor-bearing mice

Je-In Youn et al. J Leukoc Biol. 2012 Jan.

Abstract

MDSCs are a group of cells with potent immune-suppressive activity. These cells accumulate in many pathologic conditions and play a major role in the regulation of immune responses. The nature of MDSC remains highly debatable. In cancer, most MDSCs are represented by cells with granulocytic phenotype and morphology, G-MDSC. The relationship between G-MDSCs and Neu remains unclear. In this study, we have found that G-MDSCs, from tumor-bearing, and Neu, from tumor-free, mice share a common morphology and phenotype. However, in contrast to Neu, a substantial proportion of G-MDSCs expressed M-CSFR and a CD244 molecule. Neu had significantly higher phagocytic activity, expression of lysosomal proteins, and TNF-α than corresponding G-MDSCs, which had significantly higher activity of arginase, MPO, and ROS. In contrast to G-MDSC, neither rested nor mobilized Neu suppressed T cells. G-MDSC survived 2 days in culture in the presence of GM-CSF and within 24 h, became phenotypic and functionally similar to Neu. Tumor-associated G-MDSC shared most characteristics of splenic G-MDSC, rather then Neu. These data suggest that in cancer, despite morphological and phenotypic similarities, G-MDSCs are functionally distinct from Neu and are comprised of pathologically activated precursors of Neu.


Figures
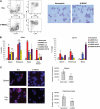
Figure 1.
Figure 1.. The morphologic features and phenotype of Neu and G-MDSC.
(A) Typical example of flow cytometric analysis of Neu and G-MDSC. Casein-induced peritoneal exudates from C57BL/6 naïve mice and splenocytes from EL-4 tumor-bearing mice were stained with anti-CD11b, anti-Ly6G, and anti-Ly6C antibodies, and CD11b+Ly6G+Ly6Chigh cells were gated as Neu and G-MDSC. Neu and G-MDSC from EL-4 tumor-bearing mice were purified as described in Materials and Methods and stained with Wright-Giemsa stain. Original magnification ×630 was used. Original scale bar = 10 μm. SSC-A=Side-scatter area. (B) Percentages of CD244- or CD115-positive cells were calculated within the populations of CD11b+Ly6G+Ly6Chigh Neu or G-MDSC. Each tumor model for G-MDSC analysis and tumor-free mice for Neu evaluation included a minimum of three mice. In all figures, mean and sd are shown. **P < 0.01; *P < 0.05, statistically significant differences between G-MDSC and Neu. Horizontal lines were used when several groups of mice had significant difference from the control. (C) Neu or G-MDSC from spleen or peritoneal cavity (Per. cav.) after mobilization with casein was purified using microbeads isolation as described in Materials and Methods. The purified cells were stained for LAMP2 (red) with counterstaining of DAPI (blue). The fluorescence intensity of LAMP2 was quantified in 50 cells. Original magnification ×630 was used. Original scale bars = 10 μm. Typical example of staining and cumulative results of four performed experiments are shown. **P < 0.01, statistically significant differences between G-MDSC and Neu.
Figure 2.
Figure 2.. Functional activity of G-MDSC and Neu.
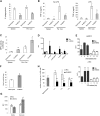
(A) Percentage of phagocytosis of latex beads in Neu and G-MDSC. Cumulative results of four performed experiments are shown. **P < 0.01, statistically significant differences between G-MDSC and Neu. (B) TNF-α production by Neu or G-MDSC. Cells were cultured overnight with or without LPS (100 ng/ml). Each culture supernatant was assayed for TNF-α by ELISA. *P < 0.05; **P < 0.01, statistically significant differences between G-MDSC and Neu. (C) MPO activity of Neu and G-MDSC measured in triplicates and repeated twice. *P < 0.05; **P < 0.01, statistically significant differences between G-MDSC and Neu. (D and E) Phospho (p)-protein analysis of Neu and G-MDSC. Four samples were tested in each group. (F) Arginase activity of Neu and G-MDSC from spleen was measured in triplicates. Cumulative results of three experiments are shown in G. The level of ROS was measured using DCFDA staining of opsonized, zymosan-stimulated cells by flow cytometry. Each experiment was performed in triplicates and repeated twice. *P < 0.05, statistically significant differences between G-MDSC and Neu. (H) Splenocytes from OT-1 C57BL/6 transgenic mice were stimulated in triplicates with specific or control peptides in the presence of different amounts of purified Neu or G-MDSC. IFN-γ production was measured using ELISPOT assay. The values of T cell activity in the presence of control peptides were subtracted from the value obtained in the presence of specific peptides. *P < 0.05; **P < 0.01, statistically significant differences between G-MDSC and Neu.
Figure 3.
Figure 3.. Analysis of G-MDSC populations.
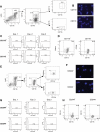
Four cell populations were sorted from spleens of EL-4 tumor-bearing mice: Ly6G+CD11b+CD115+, Ly6G+CD11b+CD115, Ly6G+CD11b+CD244+, Ly6G+CD11b+CD244. (A and E) Typical example of sorting gates. Analysis of LAMP2 expression (B and F), phagocytosis (C and G), and CD244 or CD115 expression (D and H) in sorted cells. Each experiment was performed in triplicates. Typical examples are shown. In microphotographs, original magnification ×630 was used. Original scale bars = 10 μm.
Figure 4.
Figure 4.. Association between CD244 expression and functional activity of G-MDSC.
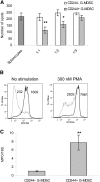
(A) Ly6G+CD11b+CD244+ and Ly6G+CD11b+CD244 were sorted from spleens of EL-4 tumor-bearing mice and incubated in triplicates at indicated ratios with OT-1 splenocytes in the presence of control or OT-1-specific peptide. IFN-γ production was measured using ELISPOT assay. The values of T cell activity in the presence of control peptides were subtracted from the value obtained in the presence of specific peptides. *P < 0.05; **P < 0.01, statistically significant differences between G-MDSC and Neu. (B) ROS level was measured by flow cytometry using DCFDA staining in gated CD244+ and CD244 G-MDSC isolated from spleens of EL-4 tumor-bearing mice. Numbers in the histograms show geometric MFI. Three experiments with similar results were performed. (C) MPO expression was measured by RT-PCR in sorted G-MDSC in triplicates. Two experiments with similar results were performed; **P < 0.01.
Figure 5.
Figure 5.. G-MDSC differentiated into Neu in culture.
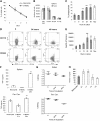
(A) CD11b+Ly6G+Ly6Chigh cells from bone marrow of naïve or EL-4 tumor-bearing mice were cultured with 10 ng/ml GM-CSF, and their survival was determined at the indicated time. (B) The same cells were cultured for 3 days with 10 ng/ml GM-CSF, 10 ng/ml G-CSF, 10 ng/ml M-CSF, or 100 ng/ml FLT3L. The number of viable cells was assessed by trypan blue exclusion. (C–H) G-MDSCs from spleen of EL-4 tumor-bearing mice were cultured with GM-CSF, and phagocytosis (C), expression of surface markers (D), and LAMP2 (E) were evaluated at the indicated time. Amount of TNF-α (F) and MPO (G) was measured in G-MDSC after cultured with GM-CSF at the indicated time-points. (H) Immune-suppressive activity was measured after 24 h incubation in complete medium. Each experiment was performed at least three times, and cumulative results are shown. **P < 0.01, statistically significant differences from freshly isolated G-MDSC (0 h). Experiments measuring MPO activity were performed twice, and individual results are presented.
Figure 6.
Figure 6.. Characteristics of G-MDSC in tumor site.
(A) Single-cell suspension from spleen or tumor tissue of EL-4 tumor-bearing mice was obtained after collagenase treatment and stained with antibodies specific for various surface markers. CD11b+Ly6G+Ly6Chigh cells were gated as G-MDSC, and the expression of CD115 and CD124 was analyzed. A typical example of three experiments is shown. (B) Typical example of LAMP2 staining. Original magnification ×630 was used. Original scale bar = 10 μm. (C) Arginase activity. *P < 0.05, statistically significant differences between G-MDSC and tumor G-MDSC. (D) MPO activity. (E) Phagocytosis of latex beads by G-MDSC. (C–E) Each group included three mice. (F) Naïve or EL-4 tumor-bearing mice were treated with BrdU for 24 h, and the BrdU uptake by CD11b+Ly6G+Ly6Chigh cells from bone marrow, spleen, and tumor was analyzed by flow cytometry. A typical example of three performed experiments is shown. 7-AAD-A, 7-Amino-actinomycin D-area.
Figure 7.
Figure 7.. Effect of tumor-derived factors on G-MDSC differentiation.
(A) CD11b+Ly6G+Ly6Chigh cells (2×10⁵) from bone marrow of naïve or EL-4 tumor-bearing mice were cultured with 10 ng/ml GM-CSF, 10 ng/ml M-CSF, or 100 ng/ml FLT3L in the presence of TES for 3 days. Viable cells were assessed using trypan blue. (B–E) G-MDSC from splenocytes of EL-4 tumor-bearing mice were cultured with 10 ng/ml GM-CSF in the presence of TES or control medium, and the viability (B), LAMP2 level (original magnification, ×630; original scale bar=10 μm; C), quantity of fluorescence intensity of LAMP2 (D), and phagocytosis (E) were assessed at indicated time-points. Each experiment was performed at least three times.

Similar articles

Cited by

References

    1. Gabrilovich D. I., Nagaraj S. (2009) Myeloid-derived suppressor cells as regulators of the immune system. Nat. Rev. Immunol. 9, 162–174 - PMC - PubMed
    1. Peranzoni E., Zilio S., Marigo I., Dolcetti L., Zanovello P., Mandruzzato S., Bronte V. (2010) Myeloid-derived suppressor cell heterogeneity and subset definition. Curr. Opin. Immunol. 22, 238–244 - PubMed
    1. Ostrand-Rosenberg S., Sinha P. (2009) Myeloid-derived suppressor cells: linking inflammation and cancer. J. Immunol. 182, 4499–4506 - PMC - PubMed
    1. Shojaei F., Wu X., Malik A. K., Zhong C., Baldwin M. E., Schanz S., Fuh G., Gerber H. P., Ferrara N. (2007) Tumor refractoriness to anti-VEGF treatment is mediated by CD11b(+)Gr1(+) myeloid cells. Nat. Biotechnol. 25, 911–920 - PubMed
    1. Yang L., Huang J., Ren X., Gorska A. E., Chytil A., Aakre M., Carbone D. P., Matrisian L. M., Richmond A., Lin P. C., Moses H. L. (2008) Abrogation of TGF β signaling in mammary carcinomas recruits Gr-1+CD11b+ myeloid cells that promote metastasis. Cancer Cell 13, 23–35 - PMC - PubMed

Publication types

MeSH terms