. 2011 Sep 26;208(10):1949-62.
doi: 10.1084/jem.20101956. Epub 2011 Sep 19.

Chemokine nitration prevents intratumoral infiltration of antigen-specific T cells

Affiliations

Chemokine nitration prevents intratumoral infiltration of antigen-specific T cells

Barbara Molon et al. J Exp Med. .

Abstract

Tumor-promoted constraints negatively affect cytotoxic T lymphocyte (CTL) trafficking to the tumor core and, as a result, inhibit tumor killing. The production of reactive nitrogen species (RNS) within the tumor microenvironment has been reported in mouse and human cancers. We describe a novel RNS-dependent posttranslational modification of chemokines that has a profound impact on leukocyte recruitment to mouse and human tumors. Intratumoral RNS production induces CCL2 chemokine nitration and hinders T cell infiltration, resulting in the trapping of tumor-specific T cells in the stroma that surrounds cancer cells. Preconditioning of the tumor microenvironment with novel drugs that inhibit CCL2 modification facilitates CTL invasion of the tumor, suggesting that these drugs may be effective in cancer immunotherapy. Our results unveil an unexpected mechanism of tumor evasion and introduce new avenues for cancer immunotherapy.


Figures
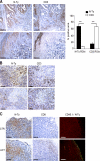
Figure 1.
Figure 1.
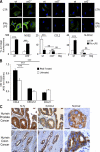
Chemical barriers inhibit T cell infiltration within the tumor. (A) Two representative serial sections of human colon carcinomas were immunostained (brown) for CD3 or nitrotyrosine, as indicated. Bars, 500 µm. Noncontiguous regions of interest (ROIs) with dimensions of 157 × 157 pixels were selected for either bright nitrotyrosine or CD3 staining and applied to serial sections. The percentages of immunoreactive areas for both nitrotyrosine and CD3 were obtained for each region of interest. ***, P < 0.001. Data are expressed as the means ± SE. (B) Two representative serial sections of human undifferentiated nasopharyngeal carcinomas were immunostained (brown) for CD3 or nitrotyrosine, as indicated. Bars, 200 µm. (C) CD45.1+ OT-I CTLs were adoptively transferred (ACT) to CD45.2+ mice bearing EG7-OVA tumors and, 4 d later, tumors were removed and stained to visualize nitrotyrosine-positive cells (N-Ty) and CTLs (either CD8+ or CD45.1+ cells). The first and second columns show the immunohistochemical detection of nitrotyrosine (N-Ty) and CD8+ T cells, respectively, whereas the third column shows immunofluorescence staining for CD45.1 (green) and N-Ty (red). Bars, 200 µm.
Figure 2.
Figure 2.
The RNS-modified CCL2 chemokine can be detected by specific antibodies. (A) Macrophages were cultured from the bone marrow of either wild-type (wt) or ccl2−/−/ccr2−/− (indicated for simplicity as ccl2−/−) mice. After stimulation with IFN-γ and LPS, macrophages were stained for NOS2, CCL2, or N-CCL2 (VHH-12BM). Background fluorescence with isotype-matched and secondary antibodies is reported in the graph and indicated as bkg. The graphs depict the mean fluorescence (mean ± SE, n = 10 ROIs). Statistical analysis was performed by a one-way ANOVA, followed by Tukey’s test (***, P < 0.001). Bars, 20 µm. (B) VHH-12BM was tested in an ELISA against human CCL-2 and N-CCL2. Unmodified CCL2, CXCL12, CCL21, N-CXCL12, and N-CCL21 were used as negative controls. Data (A and B) are representative of at least three different experiments and are expressed as the means ± SE. ***, P ≤ 0.001. (C) Immunohistochemical staining of serial sections from human prostate (n = 12; top row) and colon (n = 12; bottom row) cancers. Cancer cells expressing N-CCL2 were present within the nitrotyrosine-positive area (bars, 200 µm). The last column shows a higher magnification of the same tissues (bars, 20 µm).
Figure 3.
Figure 3.
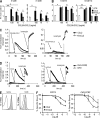
RNS alter the biological activity of human and mouse CCL2. (A and B) Human or mouse CD8+ T lymphocytes (A) and human CD14+ or mouse CD11b+ myeloid cells (B) were exposed to a gradient of recombinant human or mouse CCL2 (100, 10, or 1 ng/ml). Chemokines were either untreated (CCL2) or RNS treated (N-CCL2). Transmigrated cells were counted, and the results were expressed as fold induction over control. Data are representative of three different experiments and are expressed as the means ± SE. *, P ≤ 0.05; **, P ≤ 0.01. (C and D) Fluo-4/Fura-Red–loaded human T cells (CD14+ or CD8+; A) or CHO cells that were or were not expressing human CCR2 (CHO or CHO-CCR2; D) were stimulated with either CCL2 or N-CCL2 and free [Ca2+]i was measured by flow cytometry. Ionomycin was used as a positive control for the maximal Ca2+ influx. Data are representative of one out of three experiments. (E) Human CD8+ and CD14+ cells were stained with either anti–human CCR2 phycoerythrin-conjugated mAb or with its isotypic control. Cell fluorescence was analyzed by flow cytometry. The mean fluorescence intensity, normalized to isotype control staining, was 13.2 ± 1.7 and 2.3 ± 0.3 for hCD14 and hCD8 cells, respectively (P ≤ 0.05). (F) Competitive binding was performed by incubating CD14+ cells or CHO-CCR2 cells with 125I-hCCL2 in the presence of various concentrations of unlabeled, untreated (▪), or peroxynitrite-treated (Δ) hCCL2. After incubation, the cell-associated radioactivity was measured. Data are representative of three different experiments and are expressed as the means ± SE.
Figure 4.
Figure 4.
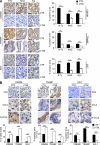
Improved intratumoral T cell migration after in vivo reduction of RNS. (A and B) Immunohistochemical staining for nitrotyrosine, NOS2, ARG1, or ARG2 (A) or CD3, CCL2, and N-CCL2 (B) in C26GM, TRAMP, and EG7 tumor samples obtained from mice either treated or not with AT38 for 7 d. The graphs represent the quantification of immunoreactive cells or areas (Student’s t test, ***, P < 0.001; n = 20). Bars: (A) 50 µm; (B, anti-CD3 pictures) 50 µm; (B, anti-CCL2 and anti-N-CCL2 pictures) 20 µm. Data are representative of three different experiments and are expressed as the means ± SE.
Figure 5.
Figure 5.
CCL2 nitration/nitrosylation prevents intratumoral T cell infiltration. EG7 tumor samples obtained from either wt or ccr2−/− mice, treated or not with AT38 for 7 d (A) or MCA-203 tumor samples obtained from wt mice that had received intratumoral injections of CCL2 (0.5 µg in hydrogel; B) were stained for CD3 by immunohistochemistry. The graphs represent the quantification of immunoreactive cells (Student’s t test; ***, P < 0.001; n = 20). Bars, 50 µm. Data are representative of three different experiments and are expressed as the means ± SE.
Figure 6.
Figure 6.
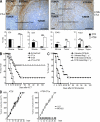
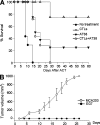
Inhibition of RNS production promotes tumor infiltration and therapeutic effectiveness of adoptively transferred, tumor-specific CTLs. EG7-OVA tumor-bearing mice (n = 18) were either untreated or treated with AT38 for 7 d (30 mg/kg/d; AT38 only) with adoptive transfer of 2 × 10⁶ CTLs (when the tumor volume was ∼300 mm3; CTLs only) or with a combination of CTLs and AT38 (4 d before and 3 d after ACT; CTLs+AT38). (A) Mice were euthanized and tumors removed to analyze the frequency and localization of CD3+, CD8+, CD45.1+, or Foxp3+ T cells within the tumors. Immunohistochemical images are shown for CD3+ T cells only, whereas the graphs represent the quantification of immunoreactive CD3+, CD8+, CD45.1+, or Foxp3+ T cells within the tumor and in the tumor-surrounding stroma. Data are expressed as the means ± SE. (Student’s t test, *, P ≤ 0.05; **, P ≤ 0.01.***, P < 0.001; n = 20). Bars, 50 µm. (B) Tumors were measured blindly using digital calipers. Mice were euthanized when the tumor area reached 1,000 mm3. Mantel-Haenszel statistics: CTLs versus AT38, P = 0.004; CTLs versus AT38+CTLs, P = 0.00003; AT38 versus AT38+CTLs, P = 0.029. (C) C57BL/6 (n = 10) and Rag2−/−γc−/− (n = 10) mice were injected with 0.5 × 10⁶ EG7-OVA cells. When the tumor volume reached ∼300 mm3, the mice were treated or not with AT38 (30 mg/kg/d) for 7 d. Mantel-Haenszel statistics: C57BL/6J AT38-treated versus C57BL/6J, untreated, P = 0.0003; Rag2−/−γc−/−, AT38-treated versus Rag2−/−γc−/−, untreated, P = 0.352. (D) Mice that had been cured by either AT38 treatment (n = 4) or by the combined immunotherapeutic protocols (AT38 plus ACT, n = 6) were subcutaneously challenged after 100 d with the same EG7-OVA cells (0.5 × 10⁶ cells/mouse), in one flank and an antigenically unrelated sarcoma (MCA-203, 106 cells/mice) that lacks OVA expression in the contralateral flank. The growth curve of the tumors is shown as an increase in the tumor volume over time from the day of the second tumor challenge. Data (A–D) are from two independent, cumulated experiments. In D, mean tumor volumes and S.E. are reported.
Figure 7.
Figure 7.
Inhibition of RNS production boosts ACT with mTERT-specific CTLs. (A) MCA-203 fibrosarcoma-bearing mice (n = 8) were either untreated or treated with AT38 for 7 d (AT38) with adoptive transfer of 2 × 10⁶ CTLs specific for the mTERT antigen (when the tumor volume reached ∼300 mm3; CTLs) or with a combination of CTLs and AT38 (4 d before and 3 d after ACT; CTLs+AT38). Mantel-Haenszel statistics: CTLs versus AT38, P = 0.18; CTLs versus AT38+CTLs, P = 0.00009; AT38 versus AT38+CTLs, P = 0.018. (B) Mice that had been cured by the combined immunotherapeutic protocols (AT38 plus ACT, n = 6) were subcutaneously challenged after 60 d with the same MCA-203 cells (106 cells/mice) in one flank and an antigenically unrelated EG7-OVA (0.5 × 10⁶ cells/mice) in the contralateral flank. The tumor growth curve is shown as an increase in the tumor volume over time from the day of the second tumor challenge. Data are from two independent, cumulated experiments. In B, mean tumor volumes and S.E. are reported.

Similar articles

Cited by

References

    1. Abello N., Kerstjens H.A., Postma D.S., Bischoff R. 2009. Protein tyrosine nitration: selectivity, physicochemical and biological consequences, denitration, and proteomics methods for the identification of tyrosine-nitrated proteins. J. Proteome Res. 8:3222–3238 10.1021/pr900039c - DOI - PubMed
    1. Allavena P., Bianchi G., Zhou D., van Damme J., Jílek P., Sozzani S., Mantovani A. 1994. Induction of natural killer cell migration by monocyte chemotactic protein-1, -2 and -3. Eur. J. Immunol. 24:3233–3236 10.1002/eji.1830241249 - DOI - PubMed
    1. Andrew P.J., Mayer B. 1999. Enzymatic function of nitric oxide synthases. Cardiovasc. Res. 43:521–531 10.1016/S0008-6363(99)00115-7 - DOI - PubMed
    1. Apolloni E., Bronte V., Mazzoni A., Serafini P., Cabrelle A., Segal D.M., Young H.A., Zanovello P. 2000. Immortalized myeloid suppressor cells trigger apoptosis in antigen-activated T lymphocytes. J. Immunol. 165:6723–6730 - PubMed
    1. Balkwill F., Mantovani A. 2001. Inflammation and cancer: back to Virchow? Lancet. 357:539–545 10.1016/S0140-6736(00)04046-0 - DOI - PubMed

Publication types