. 2011 Oct;121(10):4015-29.
doi: 10.1172/JCI45862. Epub 2011 Sep 12.

Tumor-infiltrating myeloid cells induce tumor cell resistance to cytotoxic T cells in mice

Affiliations

Tumor-infiltrating myeloid cells induce tumor cell resistance to cytotoxic T cells in mice

Tangying Lu et al. J Clin Invest. 2011 Oct.

Abstract

Cancer immunotherapeutic approaches induce tumor-specific immune responses, in particular CTL responses, in many patients treated. However, such approaches are clinically beneficial to only a few patients. We set out to investigate one possible explanation for the failure of CTLs to eliminate tumors, specifically, the concept that this failure is not dependent on inhibition of T cell function. In a previous study, we found that in mice, myeloid-derived suppressor cells (MDSCs) are a source of the free radical peroxynitrite (PNT). Here, we show that pre-treatment of mouse and human tumor cells with PNT or with MDSCs inhibits binding of processed peptides to tumor cell-associated MHC, and as a result, tumor cells become resistant to antigen-specific CTLs. This effect was abrogated in MDSCs treated with a PNT inhibitor. In a mouse model of tumor-associated inflammation in which the antitumor effects of antigen-specific CTLs are eradicated by expression of IL-1β in the tumor cells, we determined that therapeutic failure was not caused by more profound suppression of CTLs by IL-1β-expressing tumors than tumors not expressing this proinflammatory cytokine. Rather, therapeutic failure was a result of the presence of PNT. Clinical relevance for these data was suggested by the observation that myeloid cells were the predominant source of PNT in human lung, pancreatic, and breast cancer samples. Our data therefore suggest what we believe to be a novel mechanism of MDSC-mediated tumor cell resistance to CTLs.


Figures

Figure 1
Figure 1. PNT makes tumor cells resistant to CTL-mediated lysis.
(A) NO donor (1 hour pre-treatment with 1 mM SIN-1) inhibited killing of EL-4 cells subsequently washed and loaded with specific peptides (SP) by CTLs in chromium release assay. CP-EL-4 cells loaded with control peptide. (B) Pre-treatment of EL-4 cells with 0.1 mM PNT for 10 minutes inhibited killing of target cells by CTLs. In A and B, 3 experiments in duplicate were performed with similar results. Mean ± SEM of 1 experiment is shown. (C) Killing of EL-4 cells that were labeled with 2 doses of CFSE (high and low) and pre-treated with 0.1 mM PNT by CTLs. After washing EL-4 cells were loaded with a SP (high dose) or CP (low dose). Target cells were mixed at 1:1 ratio and were incubated with OT-1 T cells for 5 hours. Data are representative results of 3 experiments. Mean ± SEM of 3 experiments *P < 0.05. (DF) Experiments were performed as described in AC, except that EL-4 target cells were first loaded with SP or CP and then treated with SIN-1 or PNT. (D and E) Three experiments in duplicate were performed, with similar results. Mean ± SEM of 1 experiment is shown. (F) Cumulative data (mean ± SEM) of 3 experiments are shown. (GI) Experiments were performed essentially as described in AC, except that EG-7 cells were used as targets instead of peptide-loaded EL-4 cells. (G and H) Three experiments in duplicate were performed, with similar results. Mean ± SEM of 1 experiment is shown. (I) Cumulative data (mean ± SEM) of 3 performed experiments are shown. *P < 0.01.
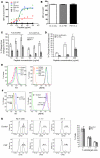
Figure 2
Figure 2. PNT affects binding of the peptides to MHC class I.
(A) Pre-treatment of target cells with PNT decreased binding of the specific peptide. EL-4 cells were treated with 0.1 mM PNT before or after loading with specific or control peptides at the indicated concentrations. Specific peptide loaded on MHC class I was detected by florescence-conjugated anti-SIINFEKL bound to H-2Kb. Typical result of 1 of 5 performed experiments is shown. (B) Effect of PNT treatment on the expression of MHC class I (H-2Kb) molecules on EL-4 tumor cells. The MFI of H-2Kb expression is shown. Data represent mean ± SEM from 3 performed experiments. (C) Effect of pre-treatment of T2 human cells with SIN-1 on the binding of HLA-A2–matching human survivin-derived peptides. “Background” indicates T2 cells incubated without peptides. Mean ± SEM of 3 experiments is shown. P < 0.05, untreated versus SIN-1–treated cells for each experimental point. (D) Binding of non-modified HLA-A2–matched human TERT-derived PVYAETKHFL and nitrated PVY(NO2)AETKHFL peptides to T2 cells. Mean ± SEM of 3 experiments is shown. P < 0.05, non-modified versus nitrated peptides for each experimental point. (E and F) PNT does not affect expression of pMHC on cells expressing single-chain H-2Kb-SIINFEKL protein. LLC (E) or B16-F10 (F) cells expressing single-chain H-2Kb-SIINFEKL were treated with PNT at indicated concentrations and then labeled with anti-NT or pMHC Abs. For each cell line, 2 experiments with the same results were performed. (G) PNT does not affect CTL killing of tumor cells expressing single-chain H-2Kb-SIINFEKL protein. Experiment was performed as described in F. LLC and LLC-H-2Kb-SIINFEKL cells were mixed at a 1:1 ratio and were untreated or pretreated with PNT, then used as targets for CTLs. Two experiments were performed, and cumulative results are shown.
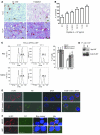
Figure 3
Figure 3. MDSCs caused tumor cell resistance to CTLs.
(A) NT (brown) and Gr-1+ or F4/80+ (red) staining in LLC and EL-4 tumors. Scale bars: 100 μm. (B) MDSCs reduced MHC class I binding ability to specific peptide (4 μg/ml) of EL-4 cells after overnight culture at a 1:1 ratio with indicated myeloid cells. Different concentrations of peptide were tested and showed similar results. PNT was used as a positive control. Percentage of change from MFI in untreated EL-4 cells set as 100% is shown. Spl, spleen; Tu, tumor; IMC, IMCs from the spleen of naive mice. Data are mean ± SEM from 4 experiments. *P < 0.05 versus control. (C) MDSCs inhibit CTL killing of target tumor cells after overnight incubation. Myeloid cells were removed, and then EL-4 cells were used as targets in CTL assay as described in Figure 1C. Result of 1 typical experiment and cumulative data (mean ± SEM) of 3 performed experiments are shown. *P < 0.05 versus IMC. (D) PNT caused nitration of tyrosine in MHC class I molecule (H-2Kb) in tumor cells. Immunoprecipitation of whole cell lysates from EL-4 cells treated with PNT was performed as described in Methods. Lysates precipitated with IgG showed no bands (not shown). (E and F) Colocalization of MHC class I and NT in tumor cells. (E) EL-4 cells treated with PNT and stained as indicated. (F) EL-4 cells were stained with blue trackers and cultured with MDSCs as described in B, myeloid cells were removed, and EL-4 cells were stained. Scale bars: 10 μm. Two experiments with the same results were performed.
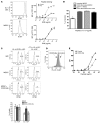
Figure 4
Figure 4. Effect of MDSCs on the protection of tumor cells from CTLs depends on ROS production.
(A) MDSCs are resistant to PNT. MDSCs or EL-4 cells were treated for 10 minutes with 0.1 mM PNT. The levels of H-2Kb expression and NT after treatments were examined by flow cytometry (left panels). Cells were labeled with SIINFEKL peptide (SIIN) conjugated with FITC; peptide binding was performed by flow cytometry, and MFI was compared. Four experiments with similar results were performed. (B) Binding of FITC-SIINFEKL peptide was measured in EL-4 cells incubated with untreated MDSCs isolated from EL-4 tumor–bearing mice, in the presence of 250 nM CDDO-Me, or MDSCs isolated from EL-4 tumor–bearing gp91phox–/– mice. As a control EL-4 cells were treated with CDDO-Me (250 nM). The background was set as 100% of peptide binding to untreated EL-4 cells. The graph shows the percentages of changes in MFI compared with background. Different concentrations of peptide were tested and showed similar results. One concentration, 4 μg/ml, is shown. Mean ± SEM of 4 experiments is shown. *P < 0.05 versus background. (C) EL-4 cells isolated from culture with MDSCs were loaded with control or specific peptides as target cells in CTL assays described in Figure 1C. MDSCs were from EL-4 tumor–bearing mice treated for 5 days with 150 mg/kg CDDO-Me or control diets. Representative 1 experiment and mean ± SEM of 3 performed experiments are shown. *P < 0.05 versus IMC-treated EL-4 cells. (D and E) Binding of peptides to tumor cells after treatment with CDDO-Me. EL-4 tumors were established in congenic (CD45.1+) mice. Mice were treated with control or CDDO-Me diets for 5 days. EL-4 (CD45.2+) cells were isolated by magnetic beads, and H-2Kb expression on tumor cells was examined by flow cytometry (D). Peptide binding was analyzed by incubation with FITC-SIINFEKL and evaluated by flow cytometry (E). Data are representative of 3 experiments with similar results.
Figure 5
Figure 5. Effect of CDDO-Me treatment on CTL recognition of tumor cells.
B16-F10 and EG-7 tumors were established s.c. in congenic (CD45.1+) C57BL/6 mice. When tumors reached 1 cm in diameter, mice were treated with CDDO-Me diet for 5 days. B16-F10 tumor cells were isolated after collagen digestion and negative selection using anti-CD45 Abs and magnetic beads. EG-7 cells were isolated using anti-CD45.2 Ab and magnetic beads. Cells were then labeled with CFSE and used for CTL assay. (A) MHC class I (H-2Kb) expression in tumor cells isolated from nontreated (solid line) and CDDO-Me–treated (dotted line) mice. (B) CTL assay with tumor cells isolated from EG-7 tumor–bearing mice. Targets: EG-7 (high CFSE dose) and EL-4 (control, low CFSE dose); effector cells: OT-1 CTLs. (C) CTL assay with tumor cells isolated from B16-F10 tumor–bearing mice. Targets: B16-F10 (high CFSE dose) and LLC (control, low CFSE dose); effectors cells: pmel-1 CTLs. (D) Cumulative results of the experiments. Mean ± SD is shown. Each group included 2–3 mice. *P < 0.05.
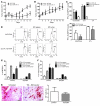
Figure 6
Figure 6. Experimental model of tumor-associated inflammation.
(A and B) LLC-OVA or LLC-IL-1β-OVA tumors were established in C57BL/6 mice. The percentages of MDSCs (A) and macrophages (B) were determined in spleens and tumors by flow cytometry. Data are mean ± SEM for 3 experiments. *P < 0.05. (C) Measurement of ROS in splenic MDSCs using the oxidation-sensitive dye DCFDA. Cells were incubated with DCFDA (2 μM) with or without PMA (300 nM) for 30 minutes in serum-free media. Cells were then washed and detected by flow cytometry. Cumulative results of 3 experiments are shown. (D) NO production by MDSCs was measured by detection of nitrite concentrations. Cumulative results of 3 experiments are shown. (E and F) NT staining in LLC and LLC-IL-1β tumors. Double staining of NT+ (brown) and either Gr-1+ or F4/80+ (red) cells in tumor tissues. Scale bars: 100 μm. (E) The percentages of NT+ cells in LLC and LLC-IL1β tumor tissues analyzed by Aperio software. Ten fields (800 × 600 μm2 each) were selected from each tumor, and mean ± SEM is shown. Four experiments with the same results were performed. *P < 0.01. (G and H) Antitumor effect of T cell therapy. Mice were injected s.c. with different numbers of LLC-OVA (G) or LLC-IL1β-OVA (H) cells, which provided for similar tumor sizes 2 weeks after inoculation. On days 18 and 23, 8 × 10⁶ activated OT-I T cells were injected i.v. Tumors were measured. Each group included 9–12 mice. Data are mean ± SEM. In G the differences were significant on day 23. (P < 0.05).
Figure 7
Figure 7. Inflammation reduced the effect of adoptive T cell therapy.
(A and B) LLC-OVA (A) or LLC-IL-1β-OVA (B) tumors were established as described in Figure 6, G and H. All mice received TBI and bone marrow transplant on day 0. OT-I T cells were transferred to the treatment groups on day 1. Data are mean ± SEM. Each group included 9–12 mice. In A the differences were significant (P < 0.01). (C and D) T cell responses. Tumor-bearing mice received TBI with bone marrow transplant and T cell transfers as described in A and B. On day 7 T cells were isolated from LNs and tumors and mixed at a 1:1 ratio with irradiated syngenic control splenocytes and stimulated with either control or specific peptides, or anti-CD3/CD28 Abs. (C) IFN-γ production was measured in ELISPOT assays. The number of spots per 5 × 10⁴ T cells was calculated. Each experiment was performed in triplicate and included 3 mice. Cumulative mean ± SEM is shown. (D) The proliferation of T cells isolated from spleens and tumors was determined by labeling of T cells with CFSE, followed by stimulation with specific or control peptides in the presence of irradiated naive splenocytes. The experiments were performed twice, with similar results. (E and F) The percentages of MDSCs (E) and macrophages (F) in spleen and tumor sites in mice 1 week after TBI and bone marrow transfer. (G) The number of NT+ cells in LLC-IL-1β-OVA tumors 7 days after TBI. Gr-1+ cells are red; NT+ cells are brown. Scale bars: 100 μm. Right panel: Cumulative results of the number of NT+ cells per 10 high-power fields (800 × 600 μm2). Each group included 3 mice.
Figure 8
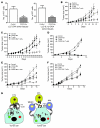
Figure 8. Inhibition of PNT production improves the antitumor effect of adoptive T cell transfer.
(A) The number of NT+ cells per 10 high-power fields (800 × 600 mm2) in LLC-OVA and LLC-IL-1β-OVA tumors 5 days after treatment with 150 mg/kg CDDO-Me or control diets. Cumulative results of 3 mice per group.*P < 0.05. (B) Combined effect of CDDO-Me and T cell transfer on growth of LLC-OVA tumor. Tumor-bearing mice were treated with control and CDDO-Me diets for 5 days with 3 days interval started on day –2. OT-1 T cells were injected on days 1 and 8. Each group included 4–5 mice. The differences between CDDO-Me + OT-1 and other groups were significant (P = 0.01). (C) Combined effect of CDDO-Me and T cell transfer on growth of LLC-IL-1β-OVA tumor. All mice received TBI and bone marrow transfer on day 0. Each group included 4 mice. The differences between CDDO-Me + OT-1 and other groups were significant (P < 0.05). (D) Effect of T cell transfer on tumor growth of LLC-H-2Kb-SIINFEKL tumor. Each group included 4–5 mice. (E and F) Combined effect of CDDO-Me and T cell transfer on growth of B16-F10 (E) or H-2Kb– B16-F10 (F) tumors. Pmel-1 T cells were injected on days 1 and 8 into mice bearing B16-F10 melanoma (E) and OT-1 T cells to mice bearing H-2Kb– B16F-10 melanoma. Each group included 4–5 mice. The differences between CDDO-Me + T cells and other groups were significant (P = 0.04). In E but not in F (P > 0.1). (BF) Mean ± SEM is shown. Tumor-bearing mice were treated as described in B. (G) Schematic of proposed effect of myeloid cells on tumor cell resistance to CTLs. Prf, perforin; GrzB, granzyme B. Red circles: processed antigen; brown: nitrated amino acids.

Similar articles

Cited by

References

    1. Jandus C, Speiser D, Romero P. Recent advances and hurdles in melanoma immunotherapy. Pigment Cell Melanoma Res. 2009;22(6):711–723. doi: 10.1111/j.1755-148X.2009.00634.x. - DOI - PubMed
    1. Lasaro MO, Ertl HC. Targeting inhibitory pathways in cancer immunotherapy. Curr Opin Immunol. 2010;22(3):385–390. doi: 10.1016/j.coi.2010.04.005. - DOI - PMC - PubMed
    1. Sarnaik AA, Weber JS. Recent advances using anti-CTLA-4 for the treatment of melanoma. Cancer J. 2009;15(3):169–173. - PubMed
    1. Muranski P, Restifo NP. Adoptive immunotherapy of cancer using CD4(+) T cells. Curr Opin Immunol. 2009;21(2):200–208. doi: 10.1016/j.coi.2009.02.004. - DOI - PMC - PubMed
    1. Rosenberg SA, Dudley ME. Adoptive cell therapy for the treatment of patients with metastatic melanoma. Curr Opin Immunol. 2009;21(2):233–240. doi: 10.1016/j.coi.2009.03.002. - DOI - PMC - PubMed

Publication types

MeSH terms