. 2011 Sep;7(9):e1002198.
doi: 10.1371/journal.ppat.1002198. Epub 2011 Sep 1.

Chlamydia trachomatis co-opts GBF1 and CERT to acquire host sphingomyelin for distinct roles during intracellular development

Affiliations

Chlamydia trachomatis co-opts GBF1 and CERT to acquire host sphingomyelin for distinct roles during intracellular development

Cherilyn A Elwell et al. PLoS Pathog. 2011 Sep.

Erratum in

  • PLoS Pathog. 2013 Aug;9(8). doi: 10.1371/annotation/f8e7c7e3-c347-4243-9146-db77900cb90c

Abstract

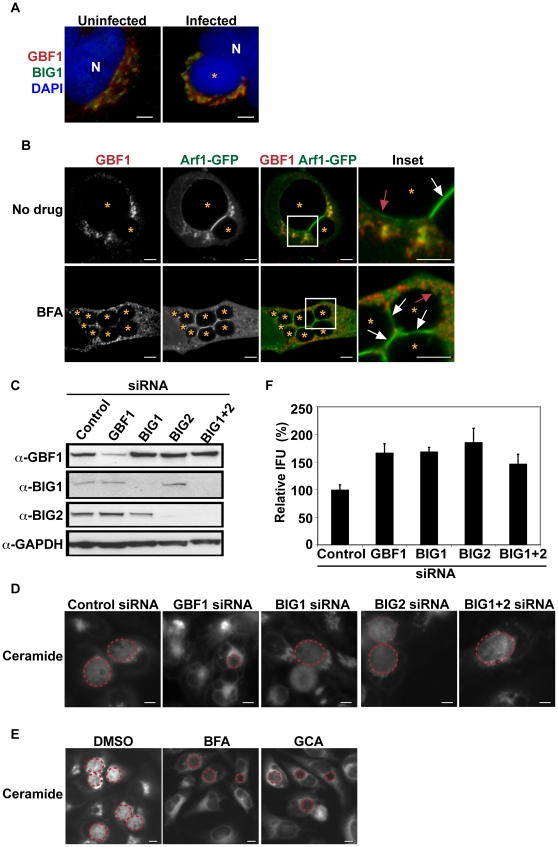
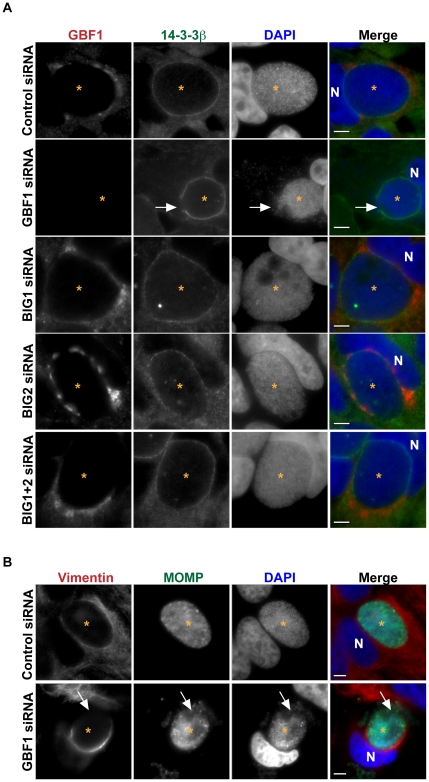
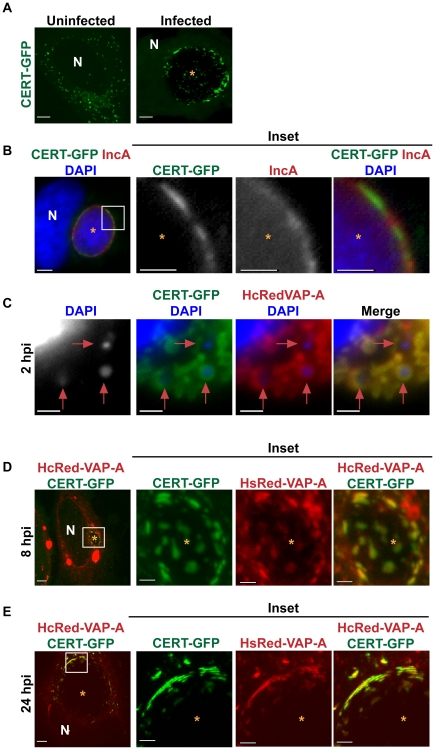
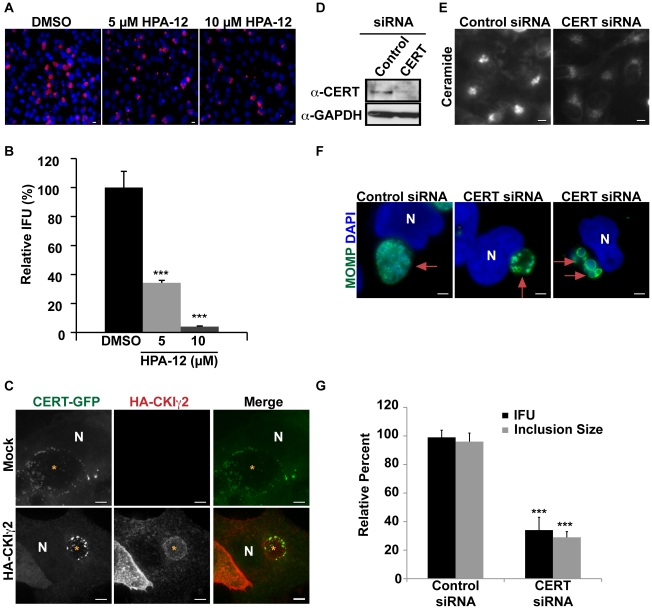
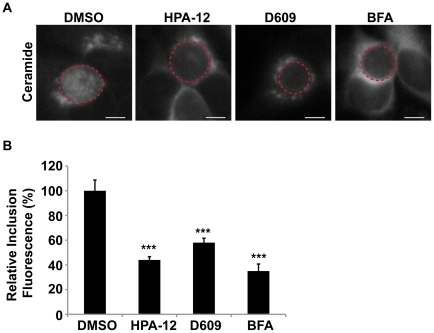
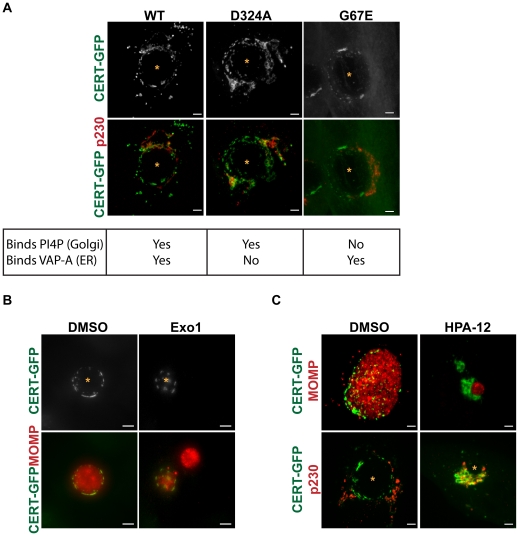
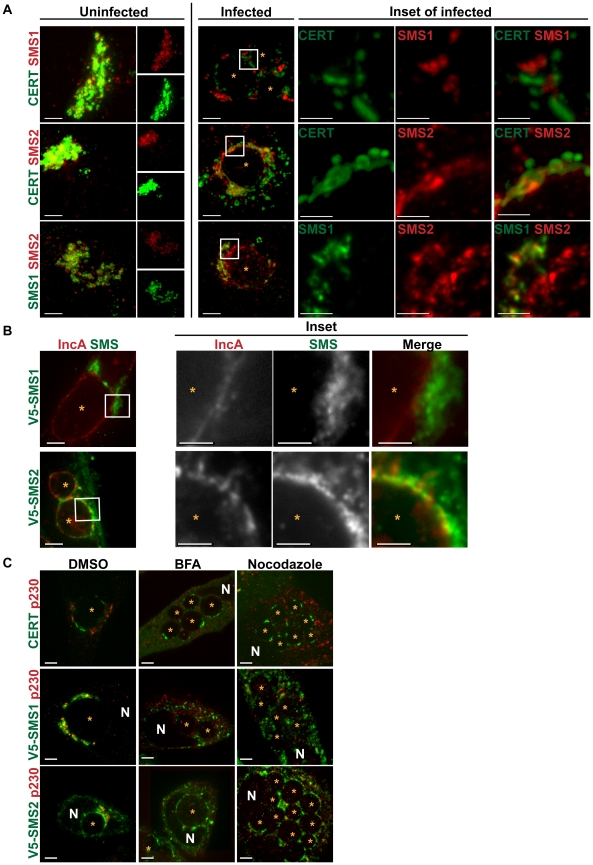
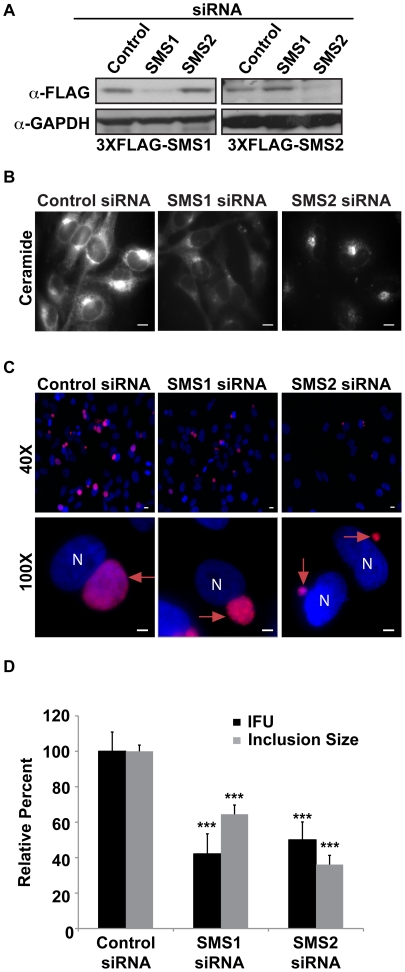
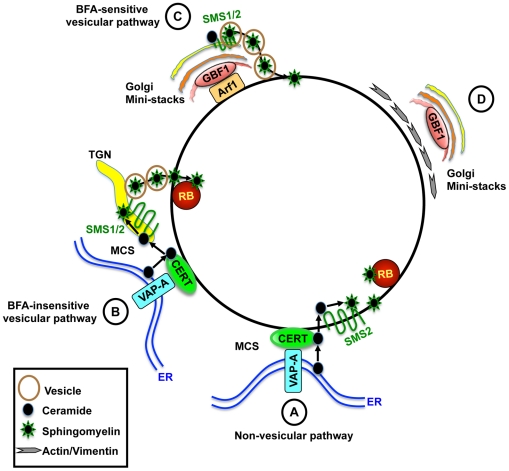
The strain designated Chlamydia trachomatis serovar that was used for experiments in this paper is Chlamydia muridarum, a species closely related to C. trachomatis (and formerly termed the Mouse Pneumonitis strain of C. trachomatis. [corrected]. The obligate intracellular pathogen Chlamydia trachomatis replicates within a membrane-bound inclusion that acquires host sphingomyelin (SM), a process that is essential for replication as well as inclusion biogenesis. Previous studies demonstrate that SM is acquired by a Brefeldin A (BFA)-sensitive vesicular trafficking pathway, although paradoxically, this pathway is dispensable for bacterial replication. This finding suggests that other lipid transport mechanisms are involved in the acquisition of host SM. In this work, we interrogated the role of specific components of BFA-sensitive and BFA-insensitive lipid trafficking pathways to define their contribution in SM acquisition during infection. We found that C. trachomatis hijacks components of both vesicular and non-vesicular lipid trafficking pathways for SM acquisition but that the SM obtained from these separate pathways is being utilized by the pathogen in different ways. We show that C. trachomatis selectively co-opts only one of the three known BFA targets, GBF1, a regulator of Arf1-dependent vesicular trafficking within the early secretory pathway for vesicle-mediated SM acquisition. The Arf1/GBF1-dependent pathway of SM acquisition is essential for inclusion membrane growth and stability but is not required for bacterial replication. In contrast, we show that C. trachomatis co-opts CERT, a lipid transfer protein that is a key component in non-vesicular ER to trans-Golgi trafficking of ceramide (the precursor for SM), for C. trachomatis replication. We demonstrate that C. trachomatis recruits CERT, its ER binding partner, VAP-A, and SM synthases, SMS1 and SMS2, to the inclusion and propose that these proteins establish an on-site SM biosynthetic factory at or near the inclusion. We hypothesize that SM acquired by CERT-dependent transport of ceramide and subsequent conversion to SM is necessary for C. trachomatis replication whereas SM acquired by the GBF1-dependent pathway is essential for inclusion growth and stability. Our results reveal a novel mechanism by which an intracellular pathogen redirects SM biosynthesis to its replicative niche.


Conflict of interest statement

The authors have declared that no competing interests exist.

Figures

Figure 1
Figure 1. GBF1 function is required for SM acquisition but not for C. trachomatis replication.
(A) HeLa cells were infected with C. trachomatis L2 for 24 hrs and then fixed and stained with antibodies to GBF1 (red) and BIG1 (green). Bacteria and host DNA were detected using DAPI (blue). The cis and trans polarity of the Golgi was maintained in C. trachomatis L2-infected cells. N, host nucleus. *, inclusion. Scale bar = 5 µm. (B) HeLa cells were transfected with Arf1-GFP for 18 hrs, infected with C. trachomatis L2 for 24 hrs in the absence or presence of 10 µM BFA, and then fixed and stained with antibodies to GBF1 (red). Enlargements of boxed regions are shown to the right. Images represent a single z slice from confocal images. The exposure time for each filter set for all images was identical. Arf1-GFP localized to the region between two closely apposed inclusions (white arrow) and to a thin rim around the inclusion (red arrow) whereas GBF1 was excluded from these regions. *, inclusion. Scale bar = 5 µm. (C) Western blot analysis of siRNA-treated samples. GAPDH was used as a loading control. (D) HeLa cells were depleted of GBF1, BIG1, and/or BIG2 for 3 days, infected with C. trachomatis L2 for 24 hrs, and then labeled with BODIPY FL-Ceramide to visualize SM acquisition by the inclusion. The exposure time for all images was identical. Dashed red lines demarcate the inclusions. Scale bar = 5 µm. (E) HeLa cells were infected with C. trachomatis for 24 hrs, treated with 10 µM BFA or GCA during the last 3 hrs of infection, and then labeled with BODIPY FL-Ceramide to analyze SM acquisition by the inclusion. The exposure time for all images was identical. Dashed red lines demarcate the inclusions. Scale bar = 5 µm. (F) HeLa cells were depleted of GBF1, BIG1, and/or BIG2 for 3 days, infected with C. trachomatis L2 for 24 hrs, and then analyzed for progeny formation as described in Materials and Methods. Values (mean ± standard error) are shown as percentage of control siRNA-treated samples. No significant decrease in progeny formation was observed. IFU, inclusion forming units.
Figure 2
Figure 2. GBF1 but not BIG1/2 function is required for inclusion membrane stability.
(A) HeLa cells were treated with the indicated siRNA for 3 days, infected with C. trachomatis L2 for 24 hrs, then fixed and stained with antibodies to 14-3-3β (green) to identify the inclusion membrane and GBF1 (red). Bacteria and host DNA were detected using DAPI (blue). The exposure time for each filter set for all images was identical. White arrows point to breaks in the inclusion membrane where the bacteria are released into cytoplasm in GBF1-depleted cells. Inclusions formed in BIG1 and/or BIG2 depleted cells remain intact. (B) HeLa cells were depleted of GBF1 for 3 days, infected with C. trachomatis L2 for 24 hrs, then fixed and stained with antibodies to MOMP (green) to identify bacteria and vimentin (red). Bacteria and host DNA were detected using DAPI (blue). The exposure time for each filter set for all images was identical. White arrows point to the region on the inclusion that is devoid of vimentin staining and where bacteria are released into the cytoplasm. N, host nucleus; *, inclusion. MOMP, C. trachomatis major outer membrane protein. Scale bar = 5 µm.
Figure 3
Figure 3. CERT and VAP-A are recruited to the inclusion.
(A) HeLa cells transfected with CERT-GFP for 18 hrs were left uninfected or infected with C. trachomatis L2 for 24 hrs. Images shown are maximum intensity projections of confocal z-stacks (0.4-µm slices). N, host nucleus; *, inclusions. Scale bar = 5 µm. (B) HeLa cells transfected with CERT-GFP were infected with C. trachomatis serovar D for 24 hrs and then fixed and stained with antibodies to IncA (red) to identify the inclusion membrane. Bacteria and host DNA were detected using DAPI (blue). Enlargements (inset) of boxed regions are shown to the right. *, inclusions. Scale bar = 5 µm. (C–E) HeLa cells were transfected with CERT-GFP and HcRedVAP-A for 18 hrs and infected with C. trachomatis L2 for (C) 2, (D) 8, or (E) 24 hrs. (C) Cells were stained with DAPI to visualize the nascent inclusions (red arrows). (D and E) Enlargements (inset) of boxed regions are shown to the right. At 8 and 24 hpi, CERT-GFP and HcRedVAP-A colocalize on the inclusion membrane and exhibit a patchy distribution. Images shown are maximum intensity projections of confocal z-stacks (0.4-µm slices). N, host nucleus; *, inclusions. Scale bar = 5 µm, except with insets from panels B, C, and D where scale bar = 2.5 µm.
Figure 4
Figure 4. CERT function is required for C. trachomatis replication.
HeLa cells were infected with C. trachomatis L2, treated with the indicated concentration of HPA-12 at 1–24 hpi, and then (A) fixed and stained with antibodies to MOMP (red) and with DAPI (blue) to visualize bacteria or (B) analyzed for progeny formation. Values (mean ± standard error) are shown as percentage of DMSO treated samples. Data are representative of 3 independent experiments. ***p<0.001 compared to DMSO treated cells (ANOVA). (C) HeLa cells were transfected with CERT-GFP and HA-CKIγ2 for 18 hrs, infected with C. trachomatis L2 for 24 hrs, and then fixed and stained with antibodies to HA (red). The exposure time for each filter set of all images was identical. Images shown are maximum intensity projections of confocal z-stacks (0.4-µm slices). Ectopic expression of HA-CKIγ2 decreased inclusion size but did not affect CERT-GFP recruitment to the inclusion membrane. Scale bar = 5 µm. (D) Western blot analysis of siRNA-treated samples. GAPDH was used as a loading control. (E) HeLa cells were depleted of CERT for 3 days and then labeled with BODIPY FL-Ceramide to analyze SM accumulation in the Golgi. The exposure time of all images was identical. CERT depletion reduced SM accumulation in the Golgi. Scale bar = 5 µm, (F) HeLa cells were depleted of CERT for 3 days, infected with C. trachomatis L2 for 24 hrs, and then fixed and stained with antibodies to MOMP (green) to identify the inclusion. Bacteria and host DNA were detected using DAPI (blue). The exposure time for all images was identical. CERT depletion reduced inclusion size. Red arrows point to inclusions. Scale bar = 5 µm. (G) HeLa cells were depleted of CERT for 3 days, infected with C. trachomatis L2 and analyzed for inclusion size and progeny formation. Values (mean ± standard error) are shown as percentage of control siRNA samples. CERT depletion significantly reduced inclusion size and progeny formation. Data are representative of 2 independent experiments. ***p<0.001 for CERT siRNA-treated cells compared to control siRNA-treated cells (ANOVA). N, host nucleus. IFU, inclusion forming units. Scale bar = 5 µm.
Figure 5
Figure 5. CERT function is required for SM acquisition.
(A) HeLa cells were infected with C. trachomatis L2 for 24 hrs, treated with 5 µM HPA-12 for the last 3 hrs of infection, and then labeled with BODIPY FL-Ceramide to analyze SM accumulation by the inclusion. As a control for decreased SM acquisition by the inclusion, cells were also treated with 10 µM BFA or 25 µg/ml D609. The exposure time of all images was identical. Dashed red lines demarcate inclusions. The residual fluorescence likely represents Golgi staining. Scale bar = 5 µm. (B) Quantitation of SM acquisition following treatment with HPA-12, D609, or BFA. Values (mean ± standard error) are shown as percentage of mean fluorescence intensities relative to DMSO-treated samples. ***p<0.001 (ANOVA). HPA-12, D609, and BFA-treated cells displayed a significant decrease in fluorescence intensity of the inclusion and its contents compared to DMSO-treated samples.
Figure 6
Figure 6. CERT transfer and/or ceramide binding activity are required for its recruitment to inclusions.
(A) HeLa cells were transfected with CERT-GFP, CERT (D324A)-GFP, or CERT (G67E)-GFP, infected with C. trachomatis L2 for 24 hrs, and then fixed and stained with an antibody to p230 (red) to identify the trans-Golgi. The exposure time for each filter set of all images was identical. Images shown are maximum intensity projections of confocal z-stacks (0.4-µm slices). Mutation of the PI4P binding (G67E) or VAP-A binding (D324A) domains did not affect CERT-GFP recruitment to the inclusion. Scale bar = 5 µm. (B) HeLa cells expressing CERT-GFP were infected with C. trachomatis L2, treated with 50 µM Exo1 (Arf1 inhibitor) for 1–24 hpi, and then fixed and stained with antibodies to MOMP (red) to identify bacteria. The exposure time for each filter set of all images was identical. Images shown are maximum intensity projections of confocal z-stacks (0.4-µm slices). CERT-GFP localization to the inclusion was unaffected by Arf1 inhibition. Scale bar = 5 µm. (C) HeLa cells expressing CERT-GFP were infected with C. trachomatis L2, treated with 5 µM HPA-12 for 1–24 hpi, and then fixed and stained with antibodies to MOMP (red) to identify bacteria or to p230 (red) to identify the trans-Golgi. The exposure time for each filter set of all images was identical. Inhibition of CERT transfer and/or ceramide binding activity by HPA-12 treatment resulted in loss of CERT accumulation on the inclusion membrane. Images shown are maximum intensity projections of confocal z-stacks (0.4-µm slices). Scale bar = 5 µm. N, host nucleus; *, inclusion.
Figure 7
Figure 7. SMS1 and SMS2 localization in C. trachomatis infected cells.
(A) HeLa cells co-transfected for 18 hrs with CERT-GFP and C-terminally 3xFLAG-tagged SMS1/SMS2 (upper 2 rows) or SMS1-V5 and C-terminally 3xFLAG-tagged SMS2 (bottom row) were infected with C. trachomatis L2 for 24 hrs, and then fixed and stained with antibodies to FLAG (red) and/or to V5 (green). Single channel images of uninfected cells are shown to the right. Enlargements of the boxed regions (inset) in infected samples are shown to the right of infected set. The exposure time for each filter set of all images was identical. Images shown are maximum intensity projections of confocal z-stacks (0.4-µm slices). CERT and SMS1 localization at the inclusion are distinct while CERT and SMS2 partially overlap. SMS2 localization partially overlaps with SMS1 around the inclusion, however SMS2 also localizes to the inclusion. At longer exposure times, SMS2 plasma membrane localization is evident. Scale bar = 5 µm, except the insets where scale bar = 2.5 µm. (B) HeLa cells transfected with SMS1-V5 (green) or SMS2-V5 (green) infected with C. trachomatis serovar D for 24 hrs and then fixed and stained with antibodies to IncA (red) to identify the inclusion membrane. Enlargements of the boxed regions (inset) are shown to the right. Images represent a single z slice from confocal images. The exposure time for each filter set for all images was identical. SMS2 but not SMS1 partially overlaps with IncA on the inclusion. Scale bar = 5 µm, except the insets where scale bar = 2.5 µm. (C) HeLa cells transfected for 18 hrs with CERT-GFP, SMS1-V5, or SMS2-V5 were infected with C. trachomatis L2, treated with 10 µM BFA or Nocodazole for 1–24 hpi, and then fixed and stained with antibodies to V5 (green) and to p230 (red) to identify the trans-Golgi. BFA and Nocodazole disrupted SMS1 localization around the inclusion but had no effect on SMS2 or CERT localization at the inclusion. Images represent a single z slice from confocal images. Scale bar = 5 µm. N, host nucleus; *, inclusion.
Figure 8
Figure 8. SMS1 and SMS2 contribute to C. trachomatis replication.
(A) Western blot analysis of siRNA-treated samples. GAPDH was used as a loading control. (B) HeLa cells were depleted of SMS1 or SMS2 for 3 days and then labeled with BODIPY FL-Ceramide to analyze SM accumulation in the Golgi. The exposure time of all images was identical. SMS1 but not SMS2 depletion reduced BODIPY FL lipid accumulation in the Golgi. Scale bar = 5 µm. (C and D) HeLa cells were depleted of SMS1 or SMS2 for 3 days, infected with C. trachomatis L2 for 24 hrs, and then fixed and stained with an antibody to MOMP (red). Bacteria and host DNA were detected using DAPI (blue). (D) SMS1 and SMS2-depleted cells were analyzed for inclusion size and progeny formation. Values (mean ± standard error) are shown as percentage of control siRNA samples. SMS1 and SMS2 depletion reduced inclusion size and production of infectious progeny. Data are representative of 2 independent experiments. ***p<0.001, all samples compared to control siRNA treatment (ANOVA). N, host nucleus; red arrows point to inclusions. IFU, inclusion forming units. Scale bar = 5 µm.
Figure 9
Figure 9. Model for the role of CERT and GBF1 in C. trachomatis infection.
(A) CERT and VAP-A are recruited to the inclusion. CERT transfers ceramide from the ER to the inclusion. Inclusion membrane localized SMS2 converts ceramide to SM, which accumulates on the inclusion membrane and on RBs. (B) Alternatively, or in addition, CERT promotes recruitment of ER-Golgi MCS to the vicinity of the inclusion, promoting efficient SM synthesis near the inclusion. SM is then transferred to the inclusion by a BFA-insensitive pathway. (C) GBF1-dependent activation of Arf1 mediates vesicular trafficking of SM-containing vesicles to the inclusion for membrane growth and stability. (D) GBF1 activity contributes to the arrangement of the actin and vimentin networks around the inclusion for additional stability. CERT is essential for bacterial replication whereas GBF1 is important for inclusion membrane growth and stability. MCS, membrane contact site; TGN, trans-Golgi network.

Comment in

Similar articles

Cited by

References

    1. Schachter J. The intracellular life of Chlamydia. Curr Topics Microbiol Immunol. 1988;138:109–139. - PubMed
    1. Campbell LA, Kuo CC. Chlamydia pneumoniae and atherosclerosis. Semin Respir Infect. 2003;18:48–54. - PubMed
    1. Hackstadt T. Cell Biology. In: Stephens R, editor. Chlamydia. Washington, D.C.: ASM press; 1999. pp. 101–138.
    1. Cocchiaro JL, Valdivia RH. New insights into Chlamydia intracellular survival mechanisms. Cell Microbiol. 2009;11:1571–1578. - PMC - PubMed
    1. Scidmore MA, Rockey DD, Fischer ER, Heinzen RA, Hackstadt T. Vesicular interactions of the Chlamydia trachomatis inclusion are determined by chlamydial early protein synthesis rather than route of entry. Infect Immun. 1996;64:5366–5372. - PMC - PubMed

Publication types

MeSH terms

Substances