Linking long-term dietary patterns with gut microbial enterotypes
- PMID: 21885731
- PMCID: PMC3368382
- DOI: 10.1126/science.1208344
Linking long-term dietary patterns with gut microbial enterotypes
Abstract
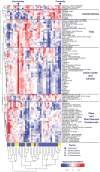
Diet strongly affects human health, partly by modulating gut microbiome composition. We used diet inventories and 16S rDNA sequencing to characterize fecal samples from 98 individuals. Fecal communities clustered into enterotypes distinguished primarily by levels of Bacteroides and Prevotella. Enterotypes were strongly associated with long-term diets, particularly protein and animal fat (Bacteroides) versus carbohydrates (Prevotella). A controlled-feeding study of 10 subjects showed that microbiome composition changed detectably within 24 hours of initiating a high-fat/low-fiber or low-fat/high-fiber diet, but that enterotype identity remained stable during the 10-day study. Thus, alternative enterotype states are associated with long-term diet.
Figures


Comment in
-
Microbiology. The guts of dietary habits.Science. 2011 Oct 7;334(6052):45-6. doi: 10.1126/science.1213799. Science. 2011. PMID: 21980098 No abstract available.
Similar articles
-
Unusual sub-genus associations of faecal Prevotella and Bacteroides with specific dietary patterns.Microbiome. 2016 Oct 21;4(1):57. doi: 10.1186/s40168-016-0202-1. Microbiome. 2016. PMID: 27769291 Free PMC article.
-
Diet, gut enterotypes and health: is there a link?Nestle Nutr Inst Workshop Ser. 2013;77:65-73. doi: 10.1159/000351385. Epub 2013 Aug 29. Nestle Nutr Inst Workshop Ser. 2013. PMID: 24107497 Review.
-
Impact of early events and lifestyle on the gut microbiota and metabolic phenotypes in young school-age children.Microbiome. 2019 Jan 4;7(1):2. doi: 10.1186/s40168-018-0608-z. Microbiome. 2019. PMID: 30609941 Free PMC article.
-
Stability of gut enterotypes in Korean monozygotic twins and their association with biomarkers and diet.Sci Rep. 2014 Dec 8;4:7348. doi: 10.1038/srep07348. Sci Rep. 2014. PMID: 25482875 Free PMC article.
-
Diet, the human gut microbiota, and IBD.Anaerobe. 2013 Dec;24:117-20. doi: 10.1016/j.anaerobe.2013.03.011. Epub 2013 Mar 30. Anaerobe. 2013. PMID: 23548695 Review.
Cited by
-
The role of the microbiome in gastrointestinal inflammation.Biosci Rep. 2021 Jun 25;41(6):BSR20203850. doi: 10.1042/BSR20203850. Biosci Rep. 2021. PMID: 34076695 Free PMC article.
-
Gut Microbial Profile Is Associated With Residential Settings and Not Nutritional Status in Adults in Karnataka, India.Front Nutr. 2021 Feb 23;8:595756. doi: 10.3389/fnut.2021.595756. eCollection 2021. Front Nutr. 2021. PMID: 33708787 Free PMC article.
-
Malnutrition and microbiota--a new relationship?Nat Rev Gastroenterol Hepatol. 2013 May;10(5):261-2. doi: 10.1038/nrgastro.2013.48. Epub 2013 Mar 19. Nat Rev Gastroenterol Hepatol. 2013. PMID: 23507796
-
The gut microbiota: a key regulator of metabolic diseases.BMB Rep. 2016 Oct;49(10):536-541. doi: 10.5483/bmbrep.2016.49.10.144. BMB Rep. 2016. PMID: 27530685 Free PMC article. Review.
-
Birth mode-dependent association between pre-pregnancy maternal weight status and the neonatal intestinal microbiome.Sci Rep. 2016 Apr 1;6:23133. doi: 10.1038/srep23133. Sci Rep. 2016. PMID: 27033998 Free PMC article.
References
Publication types
MeSH terms
Substances
Grants and funding
- UH2 DK083981/DK/NIDDK NIH HHS/United States
- T32 GM008759/GM/NIGMS NIH HHS/United States
- K24 DK078228/DK/NIDDK NIH HHS/United States
- P30 DK050306/DK/NIDDK NIH HHS/United States
- HHMI/Howard Hughes Medical Institute/United States
- S10 RR024525/RR/NCRR NIH HHS/United States
- R01 AI39368/AI/NIAID NIH HHS/United States
- T32 GM142607/GM/NIGMS NIH HHS/United States
- UL1RR024134/RR/NCRR NIH HHS/United States
- K24-DK078228/DK/NIDDK NIH HHS/United States
- R01 AI039368/AI/NIAID NIH HHS/United States
- S10RR024525/RR/NCRR NIH HHS/United States
- UL1 RR024134/RR/NCRR NIH HHS/United States
LinkOut - more resources
Full Text Sources
Other Literature Sources
Medical
Molecular Biology Databases

