. 2011 Aug;7(8):e1002140.
doi: 10.1371/journal.ppat.1002140. Epub 2011 Aug 18.

Coordination of KSHV latent and lytic gene control by CTCF-cohesin mediated chromosome conformation

Affiliations

Coordination of KSHV latent and lytic gene control by CTCF-cohesin mediated chromosome conformation

Hyojeung Kang et al. PLoS Pathog. 2011 Aug.

Abstract

Herpesvirus persistence requires a dynamic balance between latent and lytic cycle gene expression, but how this balance is maintained remains enigmatic. We have previously shown that the Kaposi's Sarcoma-Associated Herpesvirus (KSHV) major latency transcripts encoding LANA, vCyclin, vFLIP, v-miRNAs, and Kaposin are regulated, in part, by a chromatin organizing element that binds CTCF and cohesins. Using viral genome-wide chromatin conformation capture (3C) methods, we now show that KSHV latency control region is physically linked to the promoter regulatory region for ORF50, which encodes the KSHV immediate early protein RTA. Other linkages were also observed, including an interaction between the 5' and 3' end of the latency transcription cluster. Mutation of the CTCF-cohesin binding site reduced or eliminated the chromatin conformation linkages, and deregulated viral transcription and genome copy number control. siRNA depletion of CTCF or cohesin subunits also disrupted chromosomal linkages and deregulated viral latent and lytic gene transcription. Furthermore, the linkage between the latent and lytic control region was subject to cell cycle fluctuation and disrupted during lytic cycle reactivation, suggesting that these interactions are dynamic and regulatory. Our findings indicate that KSHV genomes are organized into chromatin loops mediated by CTCF and cohesin interactions, and that these inter-chromosomal linkages coordinate latent and lytic gene control.


Conflict of interest statement

The authors have declared that no competing interests exist.

Figures

Figure 1
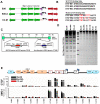
Figure 1. Chromatin conformation capture (3C) analysis of KSHV genome in BCBL1 latently infected B-cells.
A) Schematic map of CTCF binding sites in the KSHV genome. Positions at 11521, 61708, 68761, 74161, 92881, 105121, 112321, 127522, 127658, and 128436 have been validated by real-time PCR analysis of CTCF ChIP DNA. Other sites are predicted by consensus and experimentally identified at lower resolution by genome-wide array analysis. CTCF-cohesin binding site is indicated by red asterisk. Positions of the Rta gene (red arrow) and LANA gene (green arrow) are indicated. B) Map of BamHI sites in the KSHV genome. C) Real-time PCR analysis of 3C ligation products between an anchor primer (KSHV region 129180–129200, 5′ primer) with BamHI acceptor primers as indicated in the X-axis. The acceptor primers were designed from 5′ and 3′ end of BamHI fragments throughout KSHV genome. PCR products were quantified relative to BamHI religation products from Bac36A control reactions. Error bars indicate the standard deviation from the mean for three independent 3C reactions.
Figure 2
Figure 2. Construction of a KSHV bacmid genome lacking CTCF-cohesin binding sites in the latency control region.
A) Schematic diagram of bacmids Bac36, Bac36A, and CC-M (and two independent versions named CC-mt1 and CC-mt2) and the relative position of CTCF and cohesin binding sites to latency transcripts. B) Sequence of three CTCF binding sites and the substitution mutations inserted to create CC-M mutant viruses, renamed CC-mt1 and CC-mt2. C) Schematic of Amp gene insertion used to stabilize the recombination within the latency control region. D) Restriction digest demonstrating the integrity of Bac36, Bac36A, CC-mt1, CC-mt2, and revertants R-wt1, R-wt2. E) ChIP assay across the KSHV latency control region demonstrating the CC-mt1 virus fails to bind CTCF and the SMC1 cohesin subunit. Genome positions are indicated above each bar graph.
Figure 3
Figure 3. CTCF-cohesin reduces viral DNA copy number and deregulates latent and lytic gene transcription.
A) Bac36, Bac36A, and CC-mt1 were transfected into 293T cells and sorted for GFP positive expression by FACS. KSHV bacmid DNA copy number was then assayed by qPCR at 4, 8, 12, and 16 days post-sorting and quantified relative to cellular actin. B) Hygromycin resistant 293T cell pools carrying CC-mt1, CC-mt2, R-wt1, or R-wt2 KSHV bacmid DNA were cultured in the absence of hygromycin selection and then analyzed at 0, 5, 10, and 15 days for relative KSHV bacmid copy number using qPCR of KSHV DNA relative to cellular actin. C) Extracellular viral DNA was quantified after TPA and sodium butyrate treatment of hygromycin resistant 293T cell pools containing Bac36, Bac36A, or CC-mt1, followed to be pelleted KSHV virion by ultracentrifugation and subjected to real-time PCR analysis. D) Same as in panel C, for extracellular viral DNA derived from CC-mt1, CC-mt1, R-wt1, and R-wt2. E) RT-qPCR analysis of KSHV transcripts (as indicated above) in 293T cells selected for Bac36, Bac36A, or CC-mt1 genomes. F) Viral DNA copy number was measured by real-time PCR for Bac36A (grey) or CC-mt1 (red) genomes in 293 cells transfected with Rta expression vector at 0, 1, 2, or 3 days post-transfection, as indicated. DNA was measured from hygromycin resistant cell pools. G) Western blot of LANA at two different concentrations from unselected or Bac36, Bac36A, or CC-mt1 selected 293T cells. Actin is shown as a loading control.
Figure 4
Figure 4. 3C analysis of Bac36A-wt and CC-mt1 KSHV genomes in 293 cell pools.
A) 293 cell pools containing Bac36A-wt genomes were assayed by 3C using methods essentially identical to that described for Fig. 1C. B) Same as in panel A, except for CC-mt1 genomes were used for 293 cell pools. C) Bac36-wt and CC-mt1 in 293 cell pools were analyzed for 3C using conventional PCR and a different set of primer pairs for each possible BamHI junction between the anchor primer (129020-129040) and acceptor primers for fragments as indicated. PCR products wee analyzed by agarose gel and ethidium staining. Control represents product generated with bacmid religation matrix. Numbers indicate BamHI cleavage sites and re-ligation positions. Red asterisks indicate formation of correct 3C ligation products. D) Summary of most frequent chromosome interactions determined by 3C assay.
Figure 5
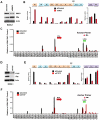
Figure 5. siRNA depletion of CTCF or Cohesin subunit SMC3 deregulates KSHV latent and lytic gene expression.
A) Western blot of BCBL1 cells treated with siSMC3 or siControl, and probed with antibody to SMC3, Rta, and Actin, as indicated. B) siSMC3 (red) or siControl (black) treated BCLB1 cells were assayed by RT-qPCR for KSHV genes K2, ORF50, ORF69, K12, v-miRNA, ORF71, ORF72, ORF73, K14, and ORF74 (left) and cellular genes GAPDH or SMC3 (right) and quantified relative to cellular actin mRNA. C) 3C analysis of BCLB1 cells treated with siSMC3 (red) or siControl (black), using anchor primer 129180–129200, essentially as described in Fig. 1. D) Western blot of BCBL1 cells treated with siCTCF or siControl and probed with antibody to CTCF, Rta, and Actin, as indicated. E) siCTCF (red) or siControl (black) treated BCBL1 cells were assayed by RT-qPCR for KSHV genes, as described in panel B. F) 3C analysis for siControl (red) or siCTCF (black) treated BCBL1 cells, essentially as described in panel C, above.
Figure 6
Figure 6. CTCF-dependent and cell-cycle dependent interactions between CTCF-cohesin and Rta (ORF50) promoter region.
A) FACS analysis of cell cycle profile for BCBL1 used for cell cycle studies. Cells were fractionated by centrifugal elutriation prior to 3C processing. B) Real-time PCR analysis of 3C ligation products from BCBL1 cells enriched in G1 (black), S (yellow) or G2 (red). Anchor primer (129180–129,200) and acceptor primers are indicated on the X-axis, and essentially identical to those used in Fig.1. Error bars represent standard deviation from the mean for three independent PCR reactions. C) Conventional PCR analysis of 3C products for KSHV BamHI digestion using anchor primer 129020–129040 and acceptor primers for conventional PCR. Cell cycle dependent 3C products were assayed for G1, S, and G2 elutriated BCLB1 cells (as indicated above). Control is ligation products of Bac36A DNA (random ligation matrix). Numbers indicate BamHI sites and religation junctions. Red asterisk indicates formation of successful 3C ligation products.
Figure 7
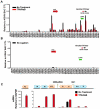
Figure 7. Loss of chromatin loops during lytic cycle reactivation.
BCBL1 cells were untreated (black bars) or treated with TPA/NaB for 24 hrs (red bars). Cells were then assayed for 3C (panel A) or control 3C lacking ligation step (panel B) or RT-PCR analysis of RNA expression for KSHV K2, ORF50, ORF69, K12, ORF72, ORF73, K14, K74, and quantified relative to cellular GAPDH, as indicated (panel C). Anchor and acceptor primers for 3C analysis are essentially the same as that shown in Fig. 1.
Figure 8
Figure 8. Model of CTCF-cohesin mediated chromatin conformation of KSHV latent episomes.
A) Linear schematic of KSHV latency control region and major latency transcripts. B) Depiction of 3C predicted loop between the CTCF-cohesin binding site and the 3′ end of the major latency transcript. C) Depiction of 3C predicted higher-order interaction between CTCF-cohesin site and the ORF50 promoter control region. Speculative model of how CTCF-cohesin may function to both insulate and coordinate latent and lytic viral gene expression.

Similar articles

Cited by

References

    1. Chang Y, Cesarman E, Pessin MS, Lee F, Culpepper J, et al. Identification of herpesvirus-like DNA sequences in AIDS-associated Kaposi's sarcoma.[comment]. Science. 1994;266:1865–1869. - PubMed
    1. Cesarman E, Chang Y, Moore PS, Said JW, Knowles DM. Kaposi's sarcoma-associated herpesvirus-like DNA sequences in AIDS- related body-cavity-based lymphomas [see comments]. N Engl J Med. 1995;332:1186–1191. - PubMed
    1. Soulier J, Grollet L, Oksenhendler E, Cacoub P, Cazals-Hatem D, et al. Kaposi's sarcoma-associated herpesvirus-like DNA sequences in multicentric Castleman's disease. Blood. 1995;86:1276–1280. - PubMed
    1. Ganem D. KSHV infection and the pathogenesis of Kaposi's sarcoma. Annu Rev Pathol. 2006;1:273–296. - PubMed
    1. Schulz TF. The pleiotropic effects of Kaposi's sarcoma herpesvirus. J Pathol. 2006;208:187–198. - PubMed

Publication types

MeSH terms

LinkOut - more resources