DNA methylation profiles of human active and inactive X chromosomes
- PMID: 21862626
- PMCID: PMC3202277
- DOI: 10.1101/gr.112680.110
DNA methylation profiles of human active and inactive X chromosomes
Abstract
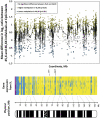
X-chromosome inactivation (XCI) is a dosage compensation mechanism that silences the majority of genes on one X chromosome in each female cell. To characterize epigenetic changes that accompany this process, we measured DNA methylation levels in 45,X patients carrying a single active X chromosome (X(a)), and in normal females, who carry one X(a) and one inactive X (X(i)). Methylated DNA was immunoprecipitated and hybridized to high-density oligonucleotide arrays covering the X chromosome, generating epigenetic profiles of active and inactive X chromosomes. We observed that XCI is accompanied by changes in DNA methylation specifically at CpG islands (CGIs). While the majority of CGIs show increased methylation levels on the X(i), XCI actually results in significant reductions in methylation at 7% of CGIs. Both intra- and inter-genic CGIs undergo epigenetic modification, with the biggest increase in methylation occurring at the promoters of genes silenced by XCI. In contrast, genes escaping XCI generally have low levels of promoter methylation, while genes that show inter-individual variation in silencing show intermediate increases in methylation. Thus, promoter methylation and susceptibility to XCI are correlated. We also observed a global correlation between CGI methylation and the evolutionary age of X-chromosome strata, and that genes escaping XCI show increased methylation within gene bodies. We used our epigenetic map to predict 26 novel genes escaping XCI, and searched for parent-of-origin-specific methylation differences, but found no evidence to support imprinting on the human X chromosome. Our study provides a detailed analysis of the epigenetic profile of active and inactive X chromosomes.
Figures


Similar articles
-
Contribution of genetic and epigenetic changes to escape from X-chromosome inactivation.Epigenetics Chromatin. 2021 Jun 29;14(1):30. doi: 10.1186/s13072-021-00404-9. Epigenetics Chromatin. 2021. PMID: 34187555 Free PMC article.
-
Landscape of DNA methylation on the X chromosome reflects CpG density, functional chromatin state and X-chromosome inactivation.Hum Mol Genet. 2015 Mar 15;24(6):1528-39. doi: 10.1093/hmg/ddu564. Epub 2014 Nov 7. Hum Mol Genet. 2015. PMID: 25381334 Free PMC article.
-
Cross-species examination of X-chromosome inactivation highlights domains of escape from silencing.Epigenetics Chromatin. 2021 Feb 17;14(1):12. doi: 10.1186/s13072-021-00386-8. Epigenetics Chromatin. 2021. PMID: 33597016 Free PMC article.
-
Variable escape from X-chromosome inactivation: identifying factors that tip the scales towards expression.Bioessays. 2014 Aug;36(8):746-56. doi: 10.1002/bies.201400032. Epub 2014 Jun 10. Bioessays. 2014. PMID: 24913292 Free PMC article. Review.
-
CpG islands--'a rough guide'.FEBS Lett. 2009 Jun 5;583(11):1713-20. doi: 10.1016/j.febslet.2009.04.012. Epub 2009 Apr 18. FEBS Lett. 2009. PMID: 19376112 Review.
Cited by
-
Genome-wide assays that identify and quantify modified cytosines in human disease studies.Epigenetics Chromatin. 2015 Jan 22;8:5. doi: 10.1186/1756-8935-8-5. eCollection 2015. Epigenetics Chromatin. 2015. PMID: 25788985 Free PMC article. Review.
-
No X-chromosome dosage compensation in human proteomes.Mol Biol Evol. 2015 Jun;32(6):1456-60. doi: 10.1093/molbev/msv036. Epub 2015 Feb 19. Mol Biol Evol. 2015. PMID: 25697342 Free PMC article.
-
Use of the FMR1 Gene Methylation Status to Assess the X-Chromosome Inactivation Pattern: A Stepwise Analysis.Genes (Basel). 2022 Feb 25;13(3):419. doi: 10.3390/genes13030419. Genes (Basel). 2022. PMID: 35327973 Free PMC article.
-
DNA methylation patterns in peripheral blood mononuclear cells from Holstein cattle with variable milk yield.BMC Genomics. 2018 Oct 11;19(1):744. doi: 10.1186/s12864-018-5124-9. BMC Genomics. 2018. PMID: 30309336 Free PMC article.
-
A distinct group of CpG islands shows differential DNA methylation between replicas of the same cell line in vitro.BMC Genomics. 2013 Oct 10;14:692. doi: 10.1186/1471-2164-14-692. BMC Genomics. 2013. PMID: 24106769 Free PMC article.
References
-
- Bailey TL, Elkan C 1994. Fitting a mixture model by expectation maximization to discover motifs in biopolymers. Proceedings of the Second International Conference on Intelligent Systems for Molecular Biology, pp. 28–36 AAAI Press, Menlo Park, CA - PubMed
-
- Barr ML, Bertram EG 1949. A morphological distinction between neurones of male and female, and the behaviour of the nucleolar satellite during accelerated nucleoprotein synthesis. Nature 163: 676–677 - PubMed
-
- Benjamini Y, Hochberg Y 1995. Controlling the false discovery rate: a practical and powerful approach to multiple testing. J R Stat Soc Ser B Methodol 57: 289–300
-
- Bernardino J, Lamoliatte E, Lombard M, Niveleau A, Malfoy B, Dutrillaux B, Bourgeois CA 1996. DNA methylation of the X chromosomes of the human female: an in situ semi-quantitative analysis. Chromosoma 104: 528–535 - PubMed
Publication types
MeSH terms
Associated data
- Actions
LinkOut - more resources
Full Text Sources
Other Literature Sources
Molecular Biology Databases
