RSEM: accurate transcript quantification from RNA-Seq data with or without a reference genome
- PMID: 21816040
- PMCID: PMC3163565
- DOI: 10.1186/1471-2105-12-323
RSEM: accurate transcript quantification from RNA-Seq data with or without a reference genome
Abstract
Background: RNA-Seq is revolutionizing the way transcript abundances are measured. A key challenge in transcript quantification from RNA-Seq data is the handling of reads that map to multiple genes or isoforms. This issue is particularly important for quantification with de novo transcriptome assemblies in the absence of sequenced genomes, as it is difficult to determine which transcripts are isoforms of the same gene. A second significant issue is the design of RNA-Seq experiments, in terms of the number of reads, read length, and whether reads come from one or both ends of cDNA fragments.
Results: We present RSEM, an user-friendly software package for quantifying gene and isoform abundances from single-end or paired-end RNA-Seq data. RSEM outputs abundance estimates, 95% credibility intervals, and visualization files and can also simulate RNA-Seq data. In contrast to other existing tools, the software does not require a reference genome. Thus, in combination with a de novo transcriptome assembler, RSEM enables accurate transcript quantification for species without sequenced genomes. On simulated and real data sets, RSEM has superior or comparable performance to quantification methods that rely on a reference genome. Taking advantage of RSEM's ability to effectively use ambiguously-mapping reads, we show that accurate gene-level abundance estimates are best obtained with large numbers of short single-end reads. On the other hand, estimates of the relative frequencies of isoforms within single genes may be improved through the use of paired-end reads, depending on the number of possible splice forms for each gene.
Conclusions: RSEM is an accurate and user-friendly software tool for quantifying transcript abundances from RNA-Seq data. As it does not rely on the existence of a reference genome, it is particularly useful for quantification with de novo transcriptome assemblies. In addition, RSEM has enabled valuable guidance for cost-efficient design of quantification experiments with RNA-Seq, which is currently relatively expensive.
Figures


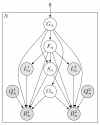
 and
and  ), quality scores (
 and
and  ), and sequences (
 and
and  ). For SE data,
  ,
,  , and
, and  are unobserved. The primary parameters of the model are given by the vector θ, which represents the prior probabilities of a fragment being derived from each transcript.
Similar articles
-
Integrative analysis with ChIP-seq advances the limits of transcript quantification from RNA-seq.Genome Res. 2016 Aug;26(8):1124-33. doi: 10.1101/gr.199174.115. Epub 2016 Jul 12. Genome Res. 2016. PMID: 27405803 Free PMC article.
-
TIGAR2: sensitive and accurate estimation of transcript isoform expression with longer RNA-Seq reads.BMC Genomics. 2014;15 Suppl 10(Suppl 10):S5. doi: 10.1186/1471-2164-15-S10-S5. Epub 2014 Dec 12. BMC Genomics. 2014. PMID: 25560536 Free PMC article.
-
EMSAR: estimation of transcript abundance from RNA-seq data by mappability-based segmentation and reclustering.BMC Bioinformatics. 2015 Sep 3;16:278. doi: 10.1186/s12859-015-0704-z. BMC Bioinformatics. 2015. PMID: 26335049 Free PMC article.
-
Comparative evaluation of full-length isoform quantification from RNA-Seq.BMC Bioinformatics. 2021 May 25;22(1):266. doi: 10.1186/s12859-021-04198-1. BMC Bioinformatics. 2021. PMID: 34034652 Free PMC article. Review.
-
Mapping RNA-seq Reads with STAR.Curr Protoc Bioinformatics. 2015 Sep 3;51:11.14.1-11.14.19. doi: 10.1002/0471250953.bi1114s51. Curr Protoc Bioinformatics. 2015. PMID: 26334920 Free PMC article. Review.
Cited by
-
Fine mapping of a major QTL, qECQ8, for rice taste quality.BMC Plant Biol. 2024 Oct 31;24(1):1034. doi: 10.1186/s12870-024-05744-8. BMC Plant Biol. 2024. PMID: 39478453 Free PMC article.
-
Multiomic analysis of familial adenomatous polyposis reveals molecular pathways associated with early tumorigenesis.Nat Cancer. 2024 Oct 30. doi: 10.1038/s43018-024-00831-z. Online ahead of print. Nat Cancer. 2024. PMID: 39478120
-
Re-programming by a six-factor-secretome in the patient tumor ecosystem during nutrient stress and drug response.iScience. 2024 Sep 11;27(10):110932. doi: 10.1016/j.isci.2024.110932. eCollection 2024 Oct 18. iScience. 2024. PMID: 39474075 Free PMC article.
-
Integrative analysis of gene expression, protein abundance, and metabolomic profiling elucidates complex relationships in chronic hyperglycemia-induced changes in human aortic smooth muscle cells.J Biol Eng. 2024 Oct 29;18(1):61. doi: 10.1186/s13036-024-00457-w. J Biol Eng. 2024. PMID: 39473010 Free PMC article.
-
Meloidogyne incognita genes involved in the repellent behavior in response to ascr#9.Sci Rep. 2024 Oct 28;14(1):25706. doi: 10.1038/s41598-024-76370-5. Sci Rep. 2024. PMID: 39465253 Free PMC article.
References
-
- Nicolae M, Mangul S, Măndoiu I, Zelikovsky A. In: Algorithms in Bioinformatics, Lecture Notes in Computer Science. Moulton V, Singh M, editor. Liverpool, UK: Springer Berlin/Heidelberg; 2010. Estimation of alternative splicing isoform frequencies from RNA-Seq data; pp. 202–214.
Publication types
MeSH terms
Substances
Grants and funding
LinkOut - more resources
Full Text Sources
Other Literature Sources
Research Materials

