

Deep sequencing of gastric carcinoma reveals somatic mutations relevant to personalized medicine
- PMID: 21781349
- PMCID: PMC3152520
- DOI: 10.1186/1479-5876-9-119
Deep sequencing of gastric carcinoma reveals somatic mutations relevant to personalized medicine
Abstract
Background: Globally, gastric cancer is the second most common cause of cancer-related death, with the majority of the health burden borne by economically less-developed countries.
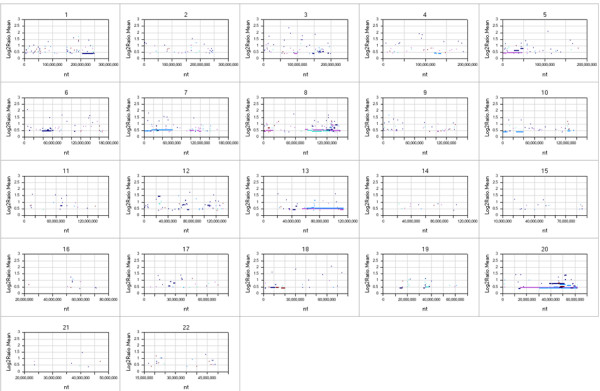
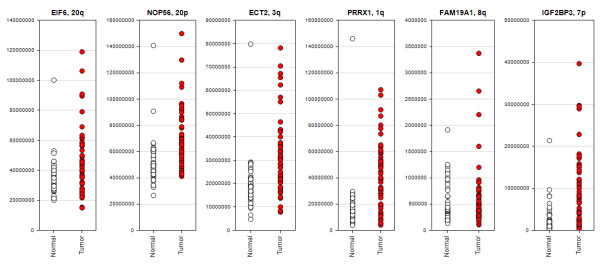
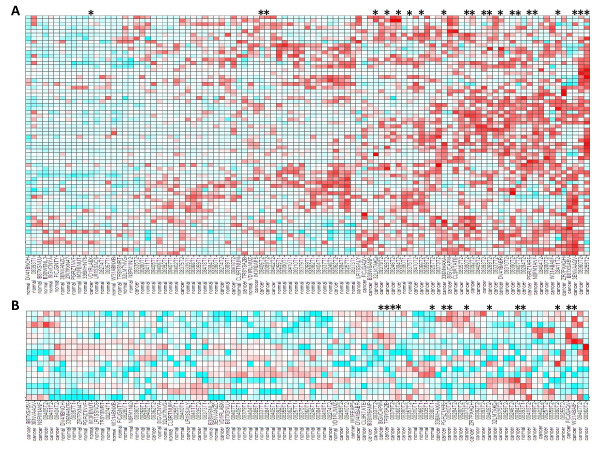
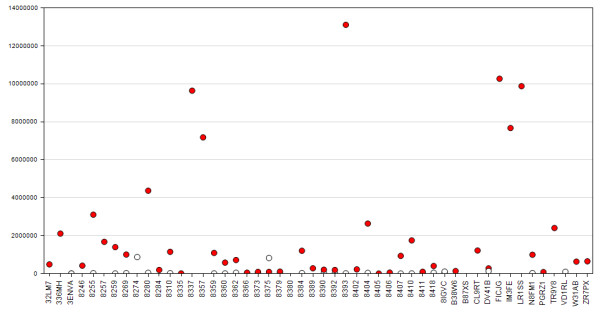
Methods: Here, we report a genetic characterization of 50 gastric adenocarcinoma samples, using affymetrix SNP arrays and Illumina mRNA expression arrays as well as Illumina sequencing of the coding regions of 384 genes belonging to various pathways known to be altered in other cancers.
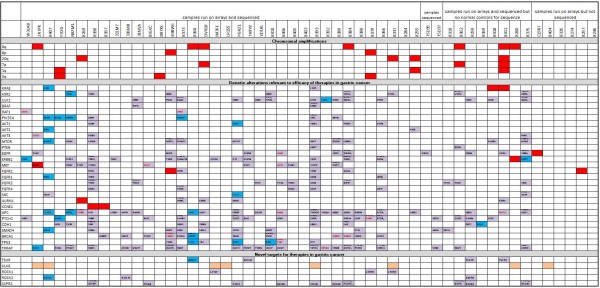
Results: Genetic alterations were observed in the WNT, Hedgehog, cell cycle, DNA damage and epithelial-to-mesenchymal-transition pathways.
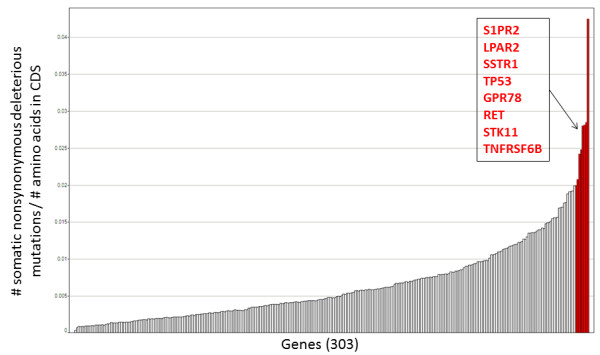
Conclusions: The data suggests targeted therapies approved or in clinical development for gastric carcinoma would be of benefit to ~22% of the patients studied. In addition, the novel mutations detected here, are likely to influence clinical response and suggest new targets for drug discovery.
Figures
Similar articles
-
Dysregulated Wnt signalling and recurrent mutations of the tumour suppressor RNF43 in early gastric carcinogenesis.J Pathol. 2016 Nov;240(3):304-314. doi: 10.1002/path.4777. J Pathol. 2016. PMID: 27514024
-
Prospective comprehensive genomic profiling of advanced gastric carcinoma cases reveals frequent clinically relevant genomic alterations and new routes for targeted therapies.Oncologist. 2015 May;20(5):499-507. doi: 10.1634/theoncologist.2014-0378. Epub 2015 Apr 16. Oncologist. 2015. PMID: 25882375 Free PMC article.
-
Multiplex profiling of peritoneal metastases from gastric adenocarcinoma identified novel targets and molecular subtypes that predict treatment response.Gut. 2020 Jan;69(1):18-31. doi: 10.1136/gutjnl-2018-318070. Epub 2019 Jun 6. Gut. 2020. PMID: 31171626 Free PMC article.
-
Identifying molecular drivers of gastric cancer through next-generation sequencing.Cancer Lett. 2013 Nov 1;340(2):241-6. doi: 10.1016/j.canlet.2012.11.029. Epub 2012 Nov 20. Cancer Lett. 2013. PMID: 23178814 Free PMC article. Review.
-
Gene mutations in gastric cancer: a review of recent next-generation sequencing studies.Tumour Biol. 2015 Sep;36(10):7385-94. doi: 10.1007/s13277-015-4002-1. Epub 2015 Sep 12. Tumour Biol. 2015. PMID: 26364057 Review.
Cited by
-
Comprehensive Integration of Genome-Wide Association and Gene Expression Studies Reveals Novel Gene Signatures and Potential Therapeutic Targets for Helicobacter pylori-Induced Gastric Disease.Front Immunol. 2021 Feb 24;12:624117. doi: 10.3389/fimmu.2021.624117. eCollection 2021. Front Immunol. 2021. PMID: 33717131 Free PMC article.
-
Application of next-generation sequencing in clinical oncology to advance personalized treatment of cancer.Chin J Cancer. 2012 Oct;31(10):463-70. doi: 10.5732/cjc.012.10216. Epub 2012 Sep 17. Chin J Cancer. 2012. PMID: 22980418 Free PMC article. Review.
-
Clinically conserved genomic subtypes of gastric adenocarcinoma.Mol Cancer. 2023 Sep 6;22(1):147. doi: 10.1186/s12943-023-01796-w. Mol Cancer. 2023. PMID: 37674200 Free PMC article.
-
Fibroblast growth factor receptor signaling as therapeutic targets in gastric cancer.World J Gastroenterol. 2016 Feb 28;22(8):2415-23. doi: 10.3748/wjg.v22.i8.2415. World J Gastroenterol. 2016. PMID: 26937130 Free PMC article. Review.
-
FGFR inhibitors: Effects on cancer cells, tumor microenvironment and whole-body homeostasis (Review).Int J Mol Med. 2016 Jul;38(1):3-15. doi: 10.3892/ijmm.2016.2620. Epub 2016 May 31. Int J Mol Med. 2016. PMID: 27245147 Free PMC article. Review.
References
MeSH terms
Substances
LinkOut - more resources
Full Text Sources
Other Literature Sources
Medical
Molecular Biology Databases
