The members of an Epstein-Barr virus microRNA cluster cooperate to transform B lymphocytes
- PMID: 21752900
- PMCID: PMC3196389
- DOI: 10.1128/JVI.05100-11
The members of an Epstein-Barr virus microRNA cluster cooperate to transform B lymphocytes
Abstract
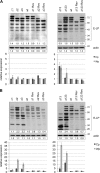
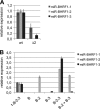
Epstein-Barr virus (EBV) transforms B lymphocytes through the expression of the latent viral proteins EBNA and latent membrane protein (LMP). Recently, it has become apparent that microRNAs (miRNAs) also contribute to EBV's oncogenic properties; recombinant EBVs that lack the BHRF1 miRNA cluster display a reduced ability to transform B lymphocytes in vitro. Furthermore, infected cells evince a marked upregulation of the EBNA genes. Using recombinant viruses that lack only one member of the cluster, we now show that all three BHRF1 miRNAs contribute to B-cell transformation. Recombinants that lacked miR-BHRF1-2 or miR-BHRF1-3 displayed enhanced EBNA expression initiated at the Cp and Wp promoters. Interestingly, we find that the deletion of miR-BHRF1-2 reduced the expression level of miR-BHRF1-3 and possibly that of miR-BHRF1-1, demonstrating that the expression of one miRNA can potentiate the expression of other miRNAs located in the same cluster. Therefore, the phenotypic traits of the miR-BHRF1-2 null mutant could result partly from reduced miR-BHRF1-1 and miR-BHRF1-3 expression levels. Nevertheless, using an miR-BHRF1-1 and miR-BHRF1-3 double mutant, we could directly assess and confirm the contribution of miR-BHRF1-2 to B-cell transformation. Furthermore, we found that the potentiating effect of miR-BHRF1-2 on miR-BHRF1-3 synthesis can be reproduced with simple expression plasmids, provided that both miRNAs are processed from the same transcript. Therefore, this enhancing effect does not result from an idiosyncrasy of the EBV genome but rather reflects a general property of these miRNAs. This study highlights the advantages of arranging the BHRF1 miRNAs in clusters: it allows the synchronous and synergistic expression of genetic elements that cooperate to transform their target cells.
Figures


Similar articles
-
Quantitative studies of Epstein-Barr virus-encoded microRNAs provide novel insights into their regulation.J Virol. 2011 Jan;85(2):996-1010. doi: 10.1128/JVI.01528-10. Epub 2010 Nov 10. J Virol. 2011. PMID: 21068248 Free PMC article.
-
A Viral microRNA Cluster Regulates the Expression of PTEN, p27 and of a bcl-2 Homolog.PLoS Pathog. 2016 Jan 22;12(1):e1005405. doi: 10.1371/journal.ppat.1005405. eCollection 2016 Jan. PLoS Pathog. 2016. PMID: 26800049 Free PMC article.
-
A viral microRNA cluster strongly potentiates the transforming properties of a human herpesvirus.PLoS Pathog. 2011 Feb;7(2):e1001294. doi: 10.1371/journal.ppat.1001294. Epub 2011 Feb 17. PLoS Pathog. 2011. PMID: 21379335 Free PMC article.
-
Genetics of Epstein-Barr virus microRNAs.Semin Cancer Biol. 2014 Jun;26:52-9. doi: 10.1016/j.semcancer.2014.02.002. Epub 2014 Mar 3. Semin Cancer Biol. 2014. PMID: 24602823 Review.
-
Role of Viral and Host microRNAs in Immune Regulation of Epstein-Barr Virus-Associated Diseases.Front Immunol. 2020 Mar 3;11:367. doi: 10.3389/fimmu.2020.00367. eCollection 2020. Front Immunol. 2020. PMID: 32194570 Free PMC article. Review.
Cited by
-
Expression of ovine herpesvirus -2 encoded microRNAs in an immortalised bovine - cell line.PLoS One. 2014 May 21;9(5):e97765. doi: 10.1371/journal.pone.0097765. eCollection 2014. PLoS One. 2014. PMID: 24849241 Free PMC article.
-
Lactic Acid Downregulates Viral MicroRNA To Promote Epstein-Barr Virus-Immortalized B Lymphoblastic Cell Adhesion and Growth.J Virol. 2018 Apr 13;92(9):e00033-18. doi: 10.1128/JVI.00033-18. Print 2018 May 1. J Virol. 2018. PMID: 29444941 Free PMC article.
-
Multiple functions are mediated by the miRNAs of Epstein-Barr virus.Curr Opin Virol. 2014 Aug;7:61-5. doi: 10.1016/j.coviro.2014.04.003. Epub 2014 May 10. Curr Opin Virol. 2014. PMID: 24814666 Free PMC article. Review.
-
Epstein-Barr Virus: Diseases Linked to Infection and Transformation.Front Microbiol. 2016 Oct 25;7:1602. doi: 10.3389/fmicb.2016.01602. eCollection 2016. Front Microbiol. 2016. PMID: 27826287 Free PMC article. Review.
-
The viral and cellular microRNA targetome in lymphoblastoid cell lines.PLoS Pathog. 2012 Jan;8(1):e1002484. doi: 10.1371/journal.ppat.1002484. Epub 2012 Jan 26. PLoS Pathog. 2012. PMID: 22291592 Free PMC article.
References
-
- Bartel D. P. 2004. MicroRNAs: genomics, biogenesis, mechanism, and function. Cell 116:281–297 - PubMed
-
- Bell A. I., et al. 2006. Analysis of Epstein-Barr virus latent gene expression in endemic Burkitt's lymphoma and nasopharyngeal carcinoma tumour cells by using quantitative real-time PCR assays. J. Gen. Virol. 87:2885–2890 - PubMed
Publication types
MeSH terms
Substances
Grants and funding
LinkOut - more resources
Full Text Sources
Miscellaneous

