MEGA5: molecular evolutionary genetics analysis using maximum likelihood, evolutionary distance, and maximum parsimony methods
- PMID: 21546353
- PMCID: PMC3203626
- DOI: 10.1093/molbev/msr121
MEGA5: molecular evolutionary genetics analysis using maximum likelihood, evolutionary distance, and maximum parsimony methods
Abstract
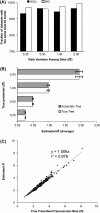
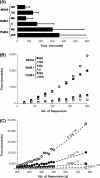
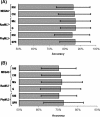
Comparative analysis of molecular sequence data is essential for reconstructing the evolutionary histories of species and inferring the nature and extent of selective forces shaping the evolution of genes and species. Here, we announce the release of Molecular Evolutionary Genetics Analysis version 5 (MEGA5), which is a user-friendly software for mining online databases, building sequence alignments and phylogenetic trees, and using methods of evolutionary bioinformatics in basic biology, biomedicine, and evolution. The newest addition in MEGA5 is a collection of maximum likelihood (ML) analyses for inferring evolutionary trees, selecting best-fit substitution models (nucleotide or amino acid), inferring ancestral states and sequences (along with probabilities), and estimating evolutionary rates site-by-site. In computer simulation analyses, ML tree inference algorithms in MEGA5 compared favorably with other software packages in terms of computational efficiency and the accuracy of the estimates of phylogenetic trees, substitution parameters, and rate variation among sites. The MEGA user interface has now been enhanced to be activity driven to make it easier for the use of both beginners and experienced scientists. This version of MEGA is intended for the Windows platform, and it has been configured for effective use on Mac OS X and Linux desktops. It is available free of charge from http://www.megasoftware.net.
Figures


Similar articles
-
MEGA4: Molecular Evolutionary Genetics Analysis (MEGA) software version 4.0.Mol Biol Evol. 2007 Aug;24(8):1596-9. doi: 10.1093/molbev/msm092. Epub 2007 May 7. Mol Biol Evol. 2007. PMID: 17488738
-
MEGA6: Molecular Evolutionary Genetics Analysis version 6.0.Mol Biol Evol. 2013 Dec;30(12):2725-9. doi: 10.1093/molbev/mst197. Epub 2013 Oct 16. Mol Biol Evol. 2013. PMID: 24132122 Free PMC article.
-
Bayesian coestimation of phylogeny and sequence alignment.BMC Bioinformatics. 2005 Apr 1;6:83. doi: 10.1186/1471-2105-6-83. BMC Bioinformatics. 2005. PMID: 15804354 Free PMC article.
-
Phylogenetic analysis in molecular evolutionary genetics.Annu Rev Genet. 1996;30:371-403. doi: 10.1146/annurev.genet.30.1.371. Annu Rev Genet. 1996. PMID: 8982459 Review.
-
Inferring trees.Methods Mol Biol. 2008;452:287-309. doi: 10.1007/978-1-60327-159-2_14. Methods Mol Biol. 2008. PMID: 18566770 Review.
Cited by
-
Increased infectivity in human cells and resistance to antibody-mediated neutralization by truncation of the SIV gp41 cytoplasmic tail.Front Microbiol. 2013 May 14;4:117. doi: 10.3389/fmicb.2013.00117. eCollection 2013. Front Microbiol. 2013. PMID: 23717307 Free PMC article.
-
Plastome sequences of Lygodium japonicum and Marsilea crenata reveal the genome organization transformation from basal ferns to core leptosporangiates.Genome Biol Evol. 2013;5(7):1403-7. doi: 10.1093/gbe/evt099. Genome Biol Evol. 2013. PMID: 23821521 Free PMC article.
-
A comprehensive analysis of the Manduca sexta immunotranscriptome.Dev Comp Immunol. 2013 Apr;39(4):388-98. doi: 10.1016/j.dci.2012.10.004. Epub 2012 Nov 23. Dev Comp Immunol. 2013. PMID: 23178408 Free PMC article.
-
Interaction effects of polycyclic aromatic hydrocarbons and heavy metals on a soil microalga, Chlorococcum sp. MM11.Environ Sci Pollut Res Int. 2015 Jun;22(12):8876-89. doi: 10.1007/s11356-013-1679-9. Epub 2013 Apr 23. Environ Sci Pollut Res Int. 2015. PMID: 23608979
-
A comparative analysis of mitochondrial ORFans: new clues on their origin and role in species with doubly uniparental inheritance of mitochondria.Genome Biol Evol. 2013;5(7):1408-34. doi: 10.1093/gbe/evt101. Genome Biol Evol. 2013. PMID: 23824218 Free PMC article.
References
-
- Alfaro ME, Huelsenbeck JP. Comparative performance of Bayesian and AIC-based measures of phylogenetic model uncertainty. Syst Biol. 2006;55:89–96. - PubMed
-
- Edwards AWF. Likelihood; an account of the statistical concept of likelihood and its application to scientific inference. Cambridge (UK): Cambridge University Press; 1972.
-
- Felsenstein J. Evolutionary trees from DNA sequences: a maximum likelihood approach. J Mol Evol. 1981;17:368–376. - PubMed
Publication types
MeSH terms
Grants and funding
LinkOut - more resources
Full Text Sources
Other Literature Sources

