

Overview of functional magnetic resonance imaging
- PMID: 21435566
- PMCID: PMC3073717
- DOI: 10.1016/j.nec.2010.11.001
Overview of functional magnetic resonance imaging
Abstract
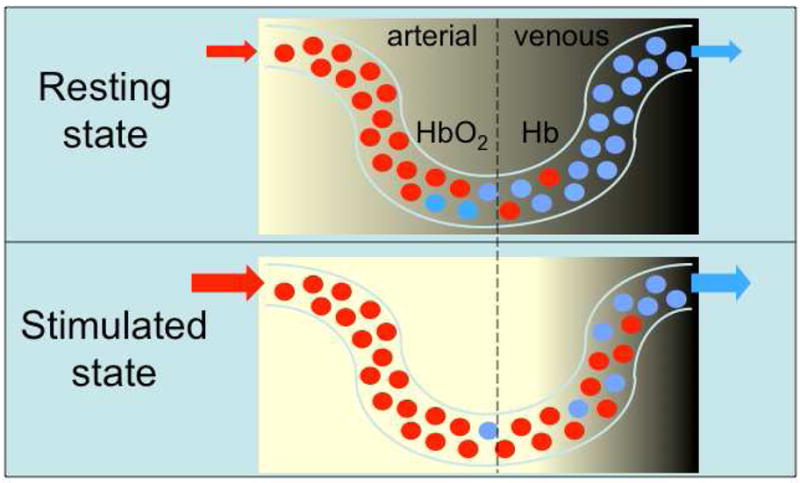
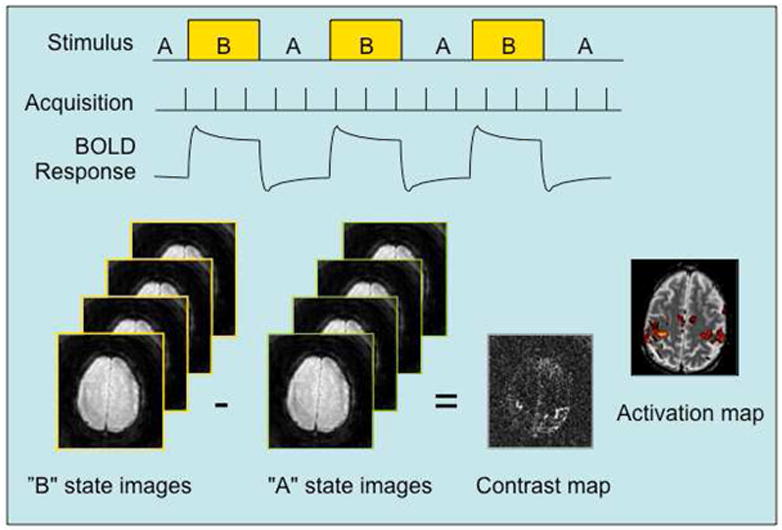
Blood Oxygen Level Dependent (BOLD) functional magnetic resonance imaging (fMRI) depicts changes in deoxyhemoglobin concentration consequent to task-induced or spontaneous modulation of neural metabolism. Since its inception in 1990, this method has been widely employed in thousands of studies of cognition for clinical applications such as surgical planning, for monitoring treatment outcomes, and as a biomarker in pharmacologic and training programs. More recently, attention is turning to the use of pattern classification and other statistical methods to draw increasingly complex inferences about cognitive brain states from fMRI data. This article reviews the methods, challenges, and future of fMRI.
Copyright © 2011 Elsevier Inc. All rights reserved.
Conflict of interest statement
The author has no conflicts to declare
Figures
Similar articles
-
Functional magnetic resonance imaging: imaging techniques and contrast mechanisms.Philos Trans R Soc Lond B Biol Sci. 1999 Jul 29;354(1387):1179-94. doi: 10.1098/rstb.1999.0473. Philos Trans R Soc Lond B Biol Sci. 1999. PMID: 10466145 Free PMC article. Review.
-
Current trends and challenges in MRI acquisitions to investigate brain function.Int J Psychophysiol. 2009 Jul;73(1):33-42. doi: 10.1016/j.ijpsycho.2008.12.020. Epub 2009 Feb 21. Int J Psychophysiol. 2009. PMID: 19236896 Free PMC article. Review.
-
Quantitative functional MRI: concepts, issues and future challenges.Neuroimage. 2012 Aug 15;62(2):1234-40. doi: 10.1016/j.neuroimage.2011.10.046. Epub 2011 Oct 20. Neuroimage. 2012. PMID: 22056462 Review.
-
The intravascular susceptibility effect and the underlying physiology of fMRI.Neuroimage. 2012 Aug 15;62(2):995-9. doi: 10.1016/j.neuroimage.2012.01.113. Epub 2012 Jan 28. Neuroimage. 2012. PMID: 22305989 Review.
-
The role of susceptibility weighted imaging in functional MRI.Neuroimage. 2012 Aug 15;62(2):923-9. doi: 10.1016/j.neuroimage.2012.01.020. Epub 2012 Jan 8. Neuroimage. 2012. PMID: 22245649 Review.
Cited by
-
Examining resting state functional connectivity and frequency power analysis in adults who stutter compared to adults who do not stutter.Front Hum Neurosci. 2024 Feb 5;18:1338966. doi: 10.3389/fnhum.2024.1338966. eCollection 2024. Front Hum Neurosci. 2024. PMID: 38375364 Free PMC article.
-
The neural effects of acupuncture for stroke: a protocol for systematic review and meta-analysis based on fMRI.Front Neurosci. 2024 Sep 6;18:1443834. doi: 10.3389/fnins.2024.1443834. eCollection 2024. Front Neurosci. 2024. PMID: 39308953 Free PMC article.
-
Ultrasonographic assessment of skeletal muscles after experimentally induced neurogenic inflammation (facet injury) in rats.Exp Biol Med (Maywood). 2022 Nov;247(21):1873-1884. doi: 10.1177/15353702221119802. Epub 2022 Sep 13. Exp Biol Med (Maywood). 2022. PMID: 36113006 Free PMC article.
-
Predicting the location of the preoptic and anterior hypothalamic region by visualizing the thermoregulatory center on fMRI in craniopharyngioma using cold and warm stimuli.Aging (Albany NY). 2021 Mar 26;13(7):10087-10098. doi: 10.18632/aging.202766. Epub 2021 Mar 26. Aging (Albany NY). 2021. PMID: 33818420 Free PMC article.
-
Neurological activation during verbal fluency task and resting-state functional connectivity abnormalities in obsessive-compulsive disorder: a functional near-infrared spectroscopy study.Front Psychiatry. 2024 Aug 30;15:1416810. doi: 10.3389/fpsyt.2024.1416810. eCollection 2024. Front Psychiatry. 2024. PMID: 39279815 Free PMC article.
References
-
- Bandettini PA, Jesmanowicz A, Wong EC, et al. Processing strategies for time-course data sets in functional MRI of the human brain. Magn Reson Med. 1993;30:161. - PubMed
-
- Bandettini PA, Wong EC, Hinks RS, et al. Time course EPI of human brain function during task activation. Magn Reson Med. 1992;25:390. - PubMed
-
- Basser PJ, Pajevic S, Pierpaoli C, et al. In vivo fiber tractography using DT-MRI data. Magn Reson Med. 2000;44:625. - PubMed
Publication types
MeSH terms
Substances
Grants and funding
LinkOut - more resources
Full Text Sources
Other Literature Sources
Medical
