

Identification of CD44 as a surface biomarker for drug resistance by surface proteome signature technology
- PMID: 21357442
- PMCID: PMC3096711
- DOI: 10.1158/1541-7786.MCR-09-0237
Identification of CD44 as a surface biomarker for drug resistance by surface proteome signature technology
Abstract
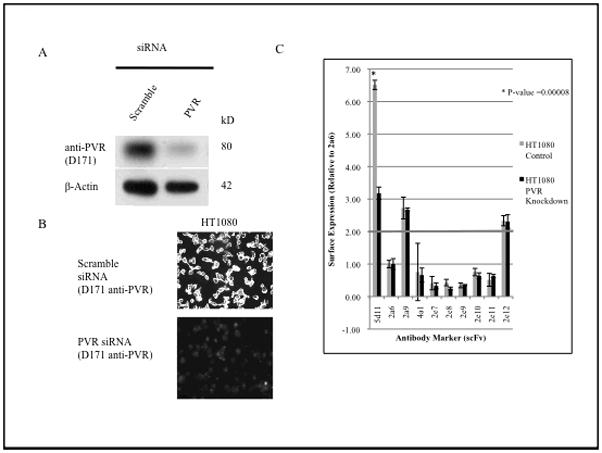
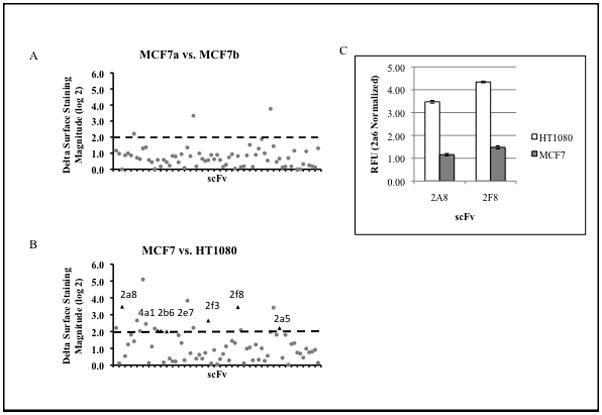
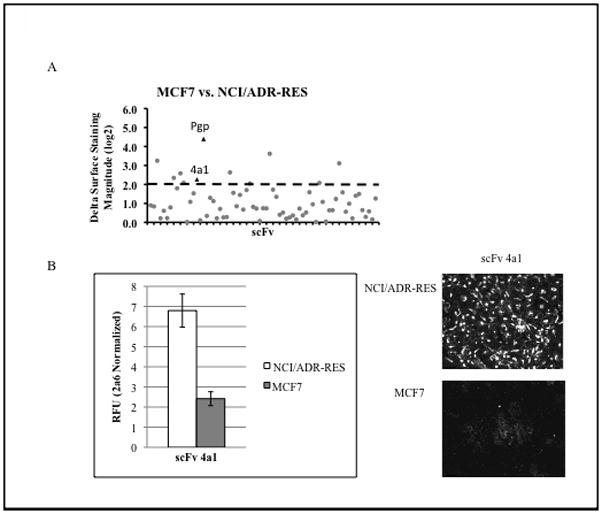
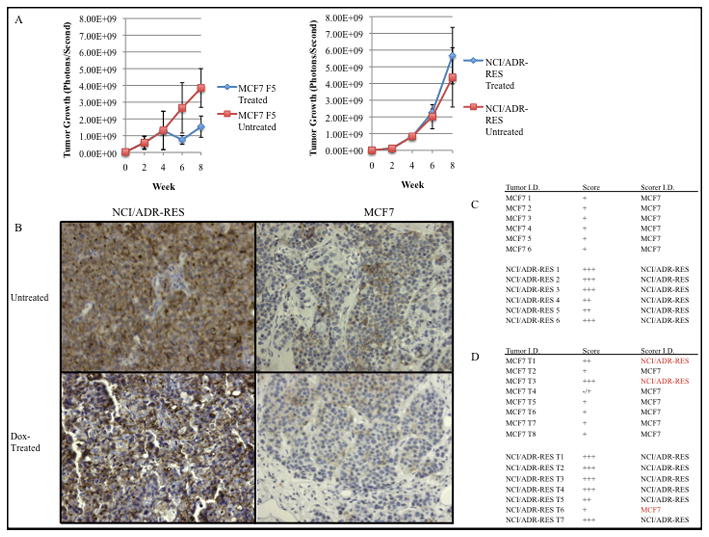
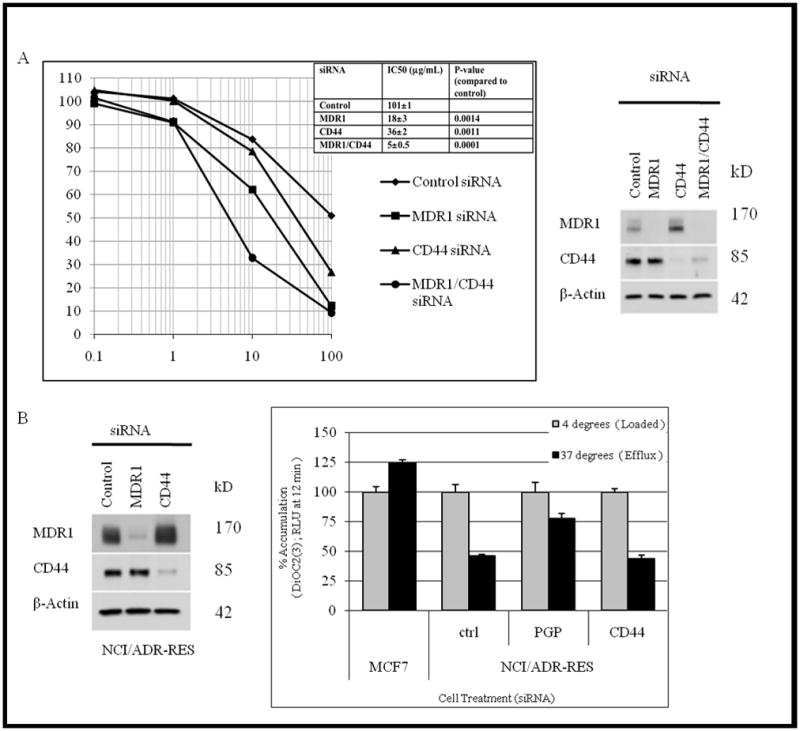
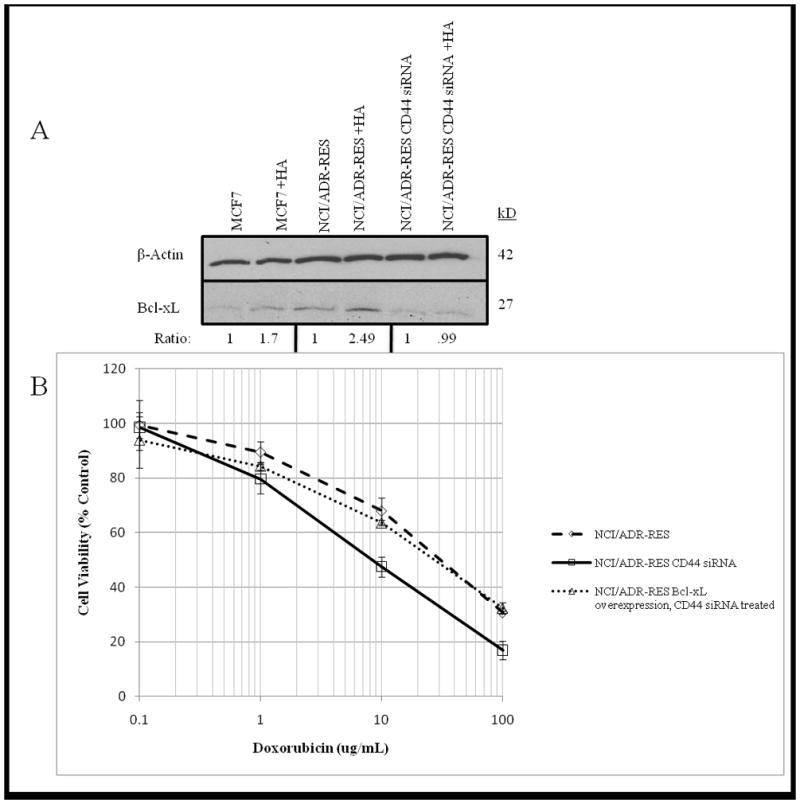
We developed surface proteome signatures (SPS) for identification of new biomarkers playing a role in cancer drug resistance. SPS compares surface antigen expression of different cell lines by immunocytochemistry of a phage display antibody library directed to surface antigens of HT1080 fibrosarcoma cells. We applied SPS to compare the surface proteomes of two epithelial derived cancer cell lines, MCF7 and NCI/ADR-RES, which is drug resistant because of overexpression of the P-glycoprotein (P-gp) drug efflux pump. Surface proteomic profiling identified CD44 as an additional biomarker that distinguishes between these two cell lines. CD44 immunohistochemistry can distinguish between tumors derived from these lines and predict tumor response to doxorubicin in vivo. We further show that CD44 plays a role in drug resistance, independently of P-gp, in NCI/ADR-RES cells and increases expression of the antiapoptotic protein Bcl-xL. Our findings illustrate the utility of SPS to distinguish between cancer cell lines and their derived tumors and identify novel biomarkers involved in drug resistance.
Figures
Similar articles
-
Prolonged drug selection of breast cancer cells and enrichment of cancer stem cell characteristics.J Natl Cancer Inst. 2010 Nov 3;102(21):1637-52. doi: 10.1093/jnci/djq361. Epub 2010 Oct 8. J Natl Cancer Inst. 2010. PMID: 20935265 Free PMC article.
-
Reversal of P-glycoprotein-mediated multidrug resistance by CD44 antibody-targeted nanocomplexes for short hairpin RNA-encoding plasmid DNA delivery.Biomaterials. 2015 Mar;45:99-114. doi: 10.1016/j.biomaterials.2014.12.030. Epub 2015 Jan 17. Biomaterials. 2015. PMID: 25662500
-
p-Glycoprotein ABCB5 and YB-1 expression plays a role in increased heterogeneity of breast cancer cells: correlations with cell fusion and doxorubicin resistance.BMC Cancer. 2010 Jul 22;10:388. doi: 10.1186/1471-2407-10-388. BMC Cancer. 2010. PMID: 20649952 Free PMC article.
-
Doxorubicin-resistant variants of human prostate cancer cell lines DU 145, PC-3, PPC-1, and TSU-PR1: characterization of biochemical determinants of antineoplastic drug sensitivity.Int J Oncol. 2000 Dec;17(6):1077-86. doi: 10.3892/ijo.17.6.1077. Int J Oncol. 2000. PMID: 11078791
-
The role of P-glycoprotein in drug resistance in multiple myeloma.Leuk Lymphoma. 2015 Jan;56(1):26-33. doi: 10.3109/10428194.2014.907890. Epub 2014 Jun 5. Leuk Lymphoma. 2015. PMID: 24678978 Review.
Cited by
-
Proteomic analyses of Sirt1-mediated cisplatin resistance in OSCC cell line.Protein J. 2011 Oct;30(7):499-508. doi: 10.1007/s10930-011-9354-9. Protein J. 2011. PMID: 21947960
-
Carbonic anhydrase XII is a new therapeutic target to overcome chemoresistance in cancer cells.Oncotarget. 2015 Mar 30;6(9):6776-93. doi: 10.18632/oncotarget.2882. Oncotarget. 2015. PMID: 25686827 Free PMC article.
-
Smart Mesoporous Silica Nanoparticles for Protein Delivery.Nanomaterials (Basel). 2019 Apr 2;9(4):511. doi: 10.3390/nano9040511. Nanomaterials (Basel). 2019. PMID: 30986952 Free PMC article. Review.
-
A framework for personalized medicine: prediction of drug sensitivity in cancer by proteomic profiling.Proteome Sci. 2012 Jun 21;10 Suppl 1(Suppl 1):S13. doi: 10.1186/1477-5956-10-S1-S13. Proteome Sci. 2012. PMID: 22759571 Free PMC article.
-
Chemotherapy induces adaptive drug resistance and metastatic potentials via phenotypic CXCR4-expressing cell state transition in ovarian cancer.PLoS One. 2017 Feb 14;12(2):e0171044. doi: 10.1371/journal.pone.0171044. eCollection 2017. PLoS One. 2017. PMID: 28196146 Free PMC article.
References
-
- Koscielny S. Critical review of microarray-based prognostic tests and trials in breast cancer. Curr Opin Obstet Gynecol. 2008;20(1):47–50. - PubMed
-
- O’Driscoll L, Clynes M. Biomarkers and multiple drug resistance in breast cancer. Curr Cancer Drug Targets. 2006 Aug;6(5):365–84. - PubMed
-
- Perou CM, Sorlie T, Eisen MB, et al. Molecular portraits of human breast tumours. Nature. 2000 Aug 17;406(6797):747–52. - PubMed
-
- Lonning PE, Sorlie T, Borresen-Dale AL. Genomics in breast cancer-therapuetic implications. Nat Clin Pract Oncol. 2005 Jan;2(1):26–33. - PubMed
Publication types
MeSH terms
Substances
Grants and funding
LinkOut - more resources
Full Text Sources
Research Materials
Miscellaneous
