. 2011 Apr 25;413(1):1-11.
doi: 10.1016/j.virol.2010.12.036. Epub 2011 Feb 25.

Infection of primary human tonsillar lymphoid cells by KSHV reveals frequent but abortive infection of T cells

Affiliations

Infection of primary human tonsillar lymphoid cells by KSHV reveals frequent but abortive infection of T cells

Jinjong Myoung et al. Virology. .

Abstract

The lymphotropic herpesvirus KSHV principally infects B cells in vivo and is linked to several human B cell lymphoproliferative syndromes. Here we examine the susceptibility of primary tonsillar lymphocytes to infection by a recombinant KSHV (rKSHV.219) that constitutively expresses GFP. At an MOI of ~1, ca. 5-10% of CD19+ B cells became GFP-positive. Surprisingly, in the same culture many more T cells became infected. However, in contrast to isolated B cells, isolated infected T cells did not support correct viral transcription and did not produce infectious virus, indicating the presence of one or more post-entry blocks to lytic KSHV replication in T cells. No immortalization or transformation has yet been observed in either B or T cells. These results affirm the feasibility of studying KSHV infection in primary lymphoid cells, and help to rationalize the detection of KSHV DNA in rare human T cell lymphomas in vivo.


Figures

Figure 1
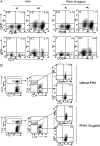
Figure 1. Ex vivo tropism of rKSHV.219 in human lymphoid aggregate culture
(A) 2×10⁶ homogenated tonsillar cells were pre-treated with PHA (10 μg/ml) for 12 hours and infected with 1.5*106 infectious units (IU) rKSHV.219 for 48 hours (MOI=0.7), after which cells were stained with either anti-CD19 (top panels) or anti-CD3 antibodies (bottom panels). KSHV infectivity in each cell type was determined by examining GFP expression by flow cytometry. (B) 2×10⁶ tonsillar cells were either treated or untreated with PHA (10 μg/ml) for 12 hours. Cells were infected at MOI 0.04 for 48 hours with subsequent staining with anti-CD3, anti-CD4, and anti-CD8 antibodies. KSHV infectivity in CD4+ or CD8+ T cells was analyzed in live CD3+ cells. A representative plot (n=14) is shown.
Figure 2
Figure 2. Reproducibility of rKSHV.219 infectivity in tonsillar B and T cells
Tonsillar cells were left untreated or treated with PHA (10 mg/ml) for 6–12 hours prior to virus infection (MOI=0.04). Virus infectivity in various cell types was determined at 48 hr post-infection by examining GFP expression by flow cytometry. Each dot represents rKSHV.219 infectivity in each cell type from individual tonsils. Mean of 10 independent experiments is provided. Statistical analysis was performed by Student t-test.
Figure 3
Figure 3. GFP+ B cells are enriched in human lymphoid aggregate culture at later stage of infection
Tonsillar cells were treated with PHA and infected as described in Figure 2. Infected culture was examined by flow cytometry for GFP expression in each cell type at day 2 and day 13. Mean of 6 independent experiments is provided. Statistical analysis was performed by Student t-test.
Figure 4
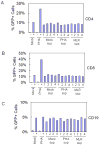
Figure 4. Cytokine-rich supernatants from activated T cells cannot enhance KSHV infection of tonsillar T cells or B cells
Culture supernatants from mock-, PHA- or MLR-stimulated cells were collected at the indicated time points (1~4 days post-stimulation) and used as conditioned medium after filtered through 0.2-μm nylon filter. Cells from fresh tonsils were treated with medium, PHA (10 μg/ml) or conditioned medium, added at 40% v/v, for 24 hours and washed extensively before virus infection. At 48 hours post-infection, cells were stained and virus infectivity was analyzed on flow by assessing GFP expression in CD4+ (A), CD8+ (B), or CD19+ (C) cells. One representative data of 3 independent experiments is shown.
Figure 5
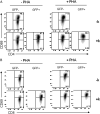
Figure 5. rKSHV.219 infection activates susceptible T cells
Tonsillar cells were treated and infected as described in Figure 5. Cells were mock infected (top panels) or infected with rKSHV.219 (bottom panels). At 48 hours post-infection, CD3+ T cells were gated and expression of activation markers, CD69 (A and B) or CD25 (C and D), in CD4+ (A and C) or CD8+ (B and D) T cells was analyzed by flow cytometry. GFP- or GFP+ cells were gated for the expression of activation markers in each cell type. A representative plot out of 4 independent experiments is shown.
Figure 6
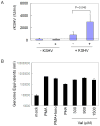
Figure 6. Infected tonsillar cells support full replication of rKSHV.219
(A) Tonsillar cells were treated with PHA (5 μg/ml) for 12 hours and infected with rKSHV.219 at MOI 0.1 for 6 hours. Cells were extensively washed with warm complete media and induced with valproate (300 μM) for 5 days. 100 μl of induced culture supernatants was added on 1×10⁵ QBI293A cells and cultured for another 48 hours before infectious units were determined by enumerating GFP+ cells by flow cytometry as described in Materials and Methods. Histograms represent mean (±SD) from 3 independent experiments. Statistical analysis was performed by Student t-test. The dotted line denotes detection limit. (B) Infected tonsillar cells as described in Figure 6A were induced with various stimuli as indicated for 5 days. Viral DNA was extracted from 100 μl induced culture supernatant and used as template for real-time PCR. Histograms represent mean (±SD) of duplicated samples. A representative plot is shown from 2 independent experiments. Val denotes valproic acid.
Fig. 7
Fig. 7. Mixed cultures, but not purified T cells, support production of infectious virus
CD3+ T cells or CD19+ B cells were isolated as described in Materials and Methods. Mixed, CD3+ T, or CD19+ B cells were infected with rKSHV.219 for 6–12 hr and infected cultures were left untreated or induced with valproic acid (300 μM) for 5 days. 100 μl of culture supernatants were infected on QBI293A cells by low speed centrifugation (2000 RPM for 90 min). GFP+ 293 cells were enumerated by FACS at d2 post-infection and infectious units (IU) were calculated by multiplying total number of 293 cells by the percentage of GFP+ cells in a given culture. Data from 3 individual tonsils are plotted with standard deviation. VAL denotes valproic acid and the dotted line indicates detection limit.
Fig 8
Fig 8. Viral gene expression in infected lymphocytes
(A) Mixed or purified cells were prepared, infected, and induced as described in Figure 7. At d2 and d4 post-induction, induced infected cultures were harvested and total RNA was extracted with 50 μl of RNA used for cDNA synthesis using gene-specific primers. Quantitative real-time PCR was performed as described in Materials and Methods with plasmids containing each gene used as standard control. Data plotted are from 3 individual tonsils. Statistical significance was analyzed by Student t-test. (B) Viral gene expression profile in purified T cells, either uninfected (lane 1) or infected (lane 2), was assessed by microarray analysis. RNA was extracted from T cells at d2 post-infection. Array analysis was done as described in Materials and Methods. Zero-transformation was done against uninfected T cells. For comparison, RNA was extracted from either BJAB cells (lane 3) or induced BCBL-1 (lane 4) at d2 post-induction by valproate (600 μM). Zero-transformation was done against BJAB cells. KSHV tiling microarray data (ordered by genome position) are displayed for 13444 unique probes. The color bar indicates the fold change relative to the level for the uninfected T cells or BJAB cells.

Similar articles

Cited by

References

    1. Altmann M, Pich D, Ruiss R, Wang J, Sugden B, Hammerschmidt W. Transcriptional activation by EBV nuclear antigen 1 is essential for the expression of EBV’s transforming genes. Proc Natl Acad Sci U S A. 2006;103(38):14188–93. - PMC - PubMed
    1. Aman P, Gordon J, Lewin N, Nordstrom M, Ehlin-Henriksson B, Klein G, Carstensson A. Surface marker characterization of EBV target cells in normal blood and tonsil B lymphocyte populations. J Immunol. 1985;135(4):2362–7. - PubMed
    1. Ambroziak JA, Blackbourn DJ, Herndier BG, Glogau RG, Gullett JH, McDonald AR, Lennette ET, Levy JA. Herpes-like sequences in HIV-infected and uninfected Kaposi’s sarcoma patients. Science. 1995;268(5210):582–3. - PubMed
    1. An J, Sun Y, Sun R, Rettig MB. Kaposi’s sarcoma-associated herpesvirus encoded vFLIP induces cellular IL-6 expression: the role of the NF-kappaB and JNK/AP1 pathways. Oncogene. 2003;22(22):3371–85. - PubMed
    1. Babcock GJ, Thorley-Lawson DA. Tonsillar memory B cells, latently infected with Epstein-Barr virus, express the restricted pattern of latent genes previously found only in Epstein-Barr virus-associated tumors. Proc Natl Acad Sci U S A. 2000;97(22):12250–5. - PMC - PubMed

Publication types