. 2011 Mar;121(3):1009-25.
doi: 10.1172/JCI44929. Epub 2011 Feb 21.

MEK-ERK pathway modulation ameliorates disease phenotypes in a mouse model of Noonan syndrome associated with the Raf1(L613V) mutation

Affiliations

MEK-ERK pathway modulation ameliorates disease phenotypes in a mouse model of Noonan syndrome associated with the Raf1(L613V) mutation

Xue Wu et al. J Clin Invest. 2011 Mar.

Abstract

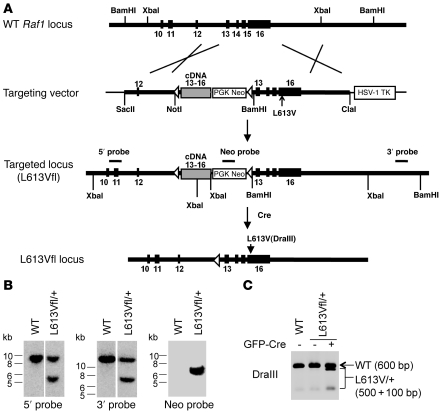
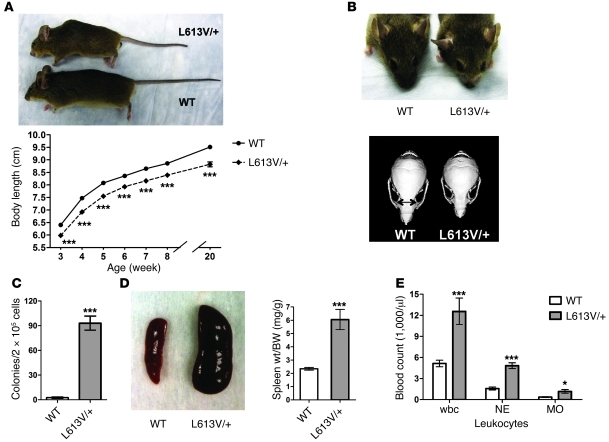
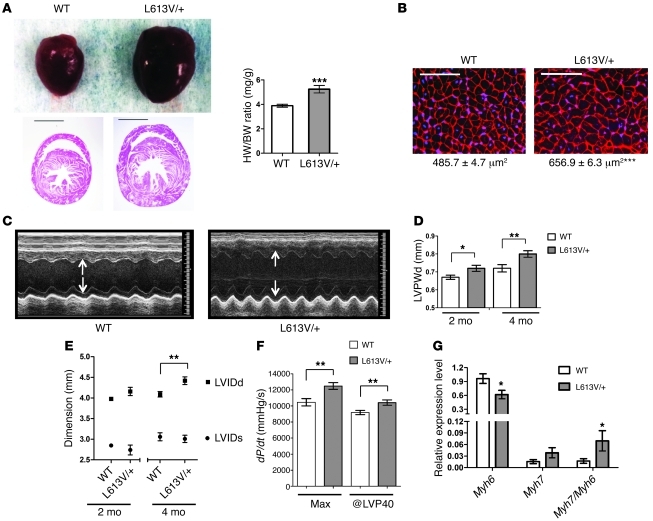
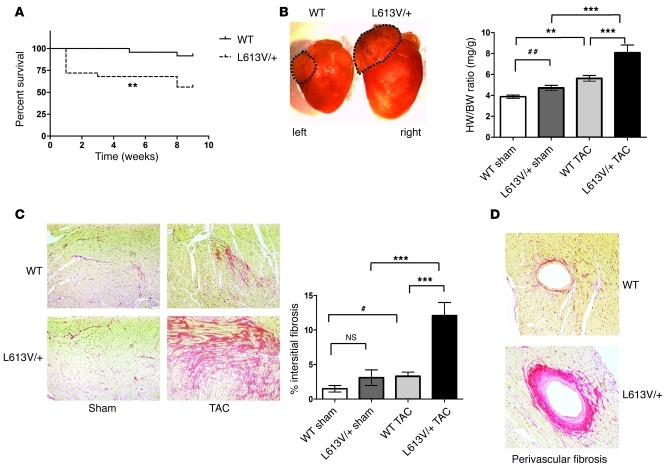
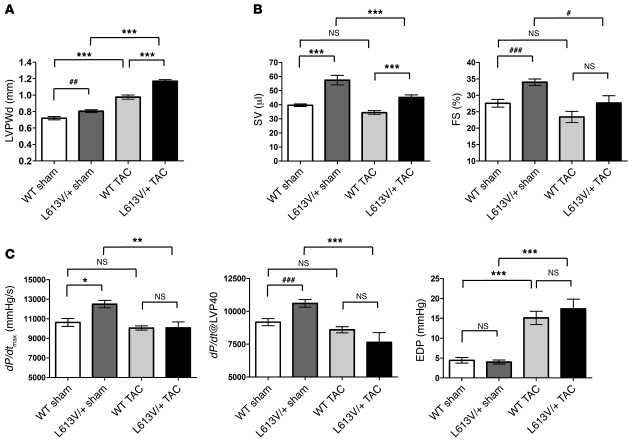
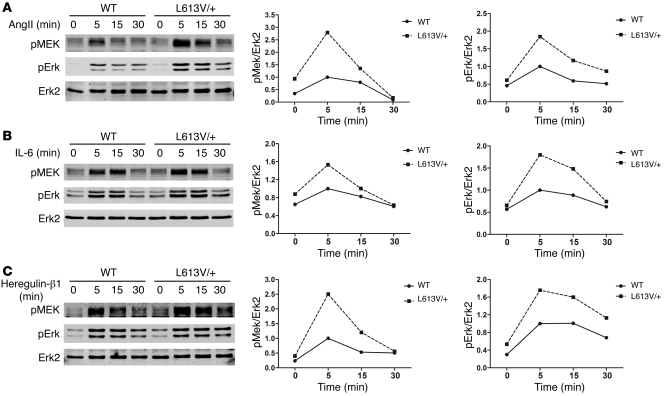
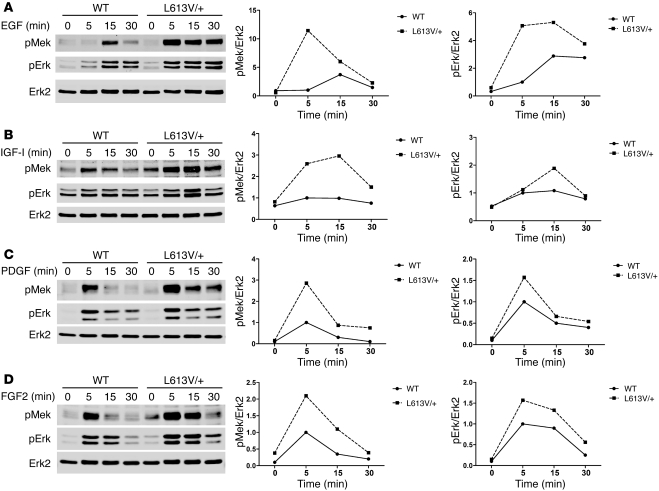
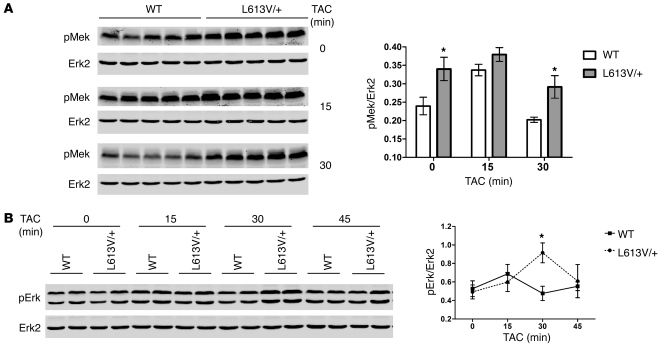
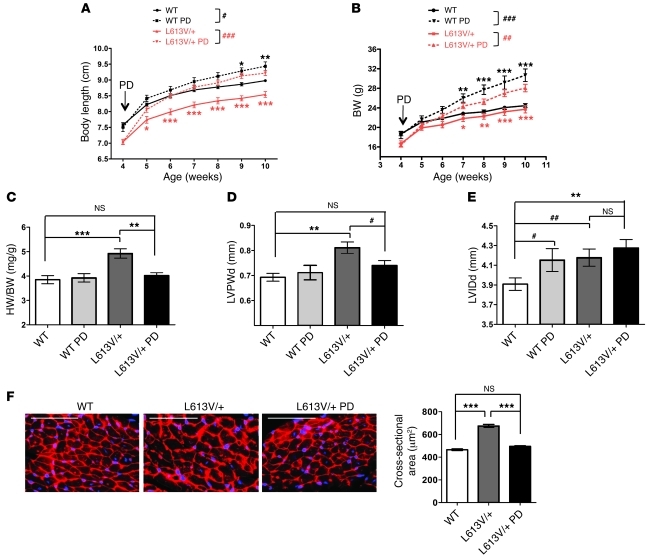
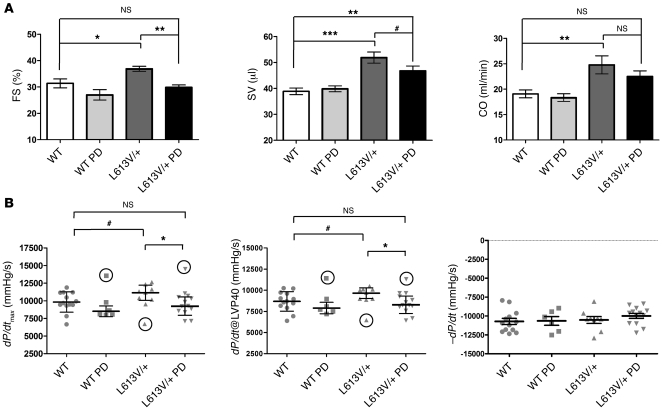
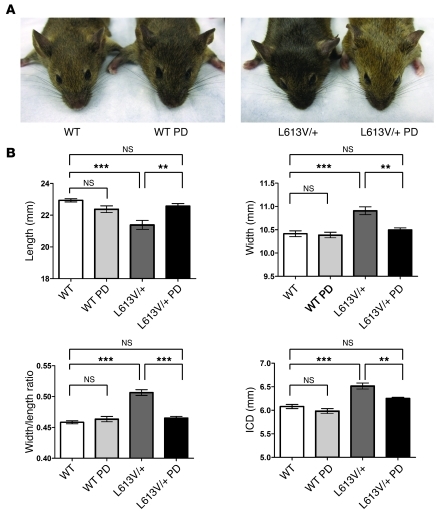
Hypertrophic cardiomyopathy (HCM) is a leading cause of sudden death in children and young adults. Abnormalities in several signaling pathways are implicated in the pathogenesis of HCM, but the role of the RAS-RAF-MEK-ERK MAPK pathway has been controversial. Noonan syndrome (NS) is one of several autosomal-dominant conditions known as RASopathies, which are caused by mutations in different components of this pathway. Germline mutations in RAF1 (which encodes the serine-threonine kinase RAF1) account for approximately 3%-5% of cases of NS. Unlike other NS alleles, RAF1 mutations that confer increased kinase activity are highly associated with HCM. To explore the pathogenesis of such mutations, we generated knockin mice expressing the NS-associated Raf1(L613V) mutation. Like NS patients, mice heterozygous for this mutation (referred to herein as L613V/+ mice) had short stature, craniofacial dysmorphia, and hematologic abnormalities. Valvuloseptal development was normal, but L613V/+ mice exhibited eccentric cardiac hypertrophy and aberrant cardiac fetal gene expression, and decompensated following pressure overload. Agonist-evoked MEK-ERK activation was enhanced in multiple cell types, and postnatal MEK inhibition normalized the growth, facial, and cardiac defects in L613V/+ mice. These data show that different NS genes have intrinsically distinct pathological effects, demonstrate that enhanced MEK-ERK activity is critical for causing HCM and other RAF1-mutant NS phenotypes, and suggest a mutation-specific approach to the treatment of RASopathies.


Figures

Figure 1
Figure 1. Generation of inducible Raf1L613V knockin mice.
(A) Targeting strategy. Structures of the Raf1 locus, targeting vector, mutant allele, and location of probes for Southern blotting are shown. (B) Correct targeting of ES cells. Genomic DNA from WT ES cells and PCR-positive L613Vfl/+ ES clones was digested with XbaI (5′ and Neo probe) or BamHI (3′ probe) and subjected to Southern blotting with 5′, 3′, or Neo probes. Blots with 5′ and 3′ probes were run on the same gel but were noncontiguous (white lines). (C) Expression of Raf1L613V allele is inducible. RNA was isolated from WT and L613Vfl/+ ES cells with or without prior transfection of MSCV-Cre-GFP plasmid and reverse transcribed into cDNA. A PCR product, obtained by using primers within exon 11 and at the end of exon 16 of the Raf1 cDNA, was digested with DraIII. Note that the mutant allele was silent until Cre was introduced, and then was expressed efficiently.
Figure 2
Figure 2. L613V/+ mice show multiple NS phenotypes.
(A) Short stature in L613V/+ mice. Gross appearance of 2-month-old WT and L613V/+ male mice and growth curves of WT (n = 45) and L613V/+ (n = 45) male mice are shown. Differences were significant at all time points (P < 0.0001, 2-way repeated-measures ANOVA; ***P < 0.0001, Bonferroni post-test). (B) L613V/+ mice have facial dysmorphia. Gross facial appearance and representative μCT scans of skulls from WT and L613V/+ mice. Double-headed arrows indicate inner canthal distance. See Table 1 for morphometric measurements. (C) Cytokine-independent myeloid colonies from BM of 2-month-old mice (n = 6 per genotype). ***P < 0.0001, 2-tailed Student’s t test. (D) Splenomegaly in L613V/+ mice. Representative gross appearance and spleen weight/BW ratio in WT (n = 25) and L613V/+ (n = 25) mice at 4 months. ***P < 0.0001, 2-tailed Student’s t test. (E) Increased total wbcs, neutrophils (NE), and monocytes (MO) in 1-year-old L613V/+ mice (n = 8 per genotype). *P < 0.05, ***P < 0.0001, 2-tailed Student’s t test.
Figure 3
Figure 3. L613V/+ mice show cardiac hypertrophy with chamber dilatation.
(A) Representative gross appearance and H&E-stained cross-sections (original magnification, ×4; scale bars: 2 mm) of WT (n = 25) and L613V/+ (n = 25) hearts at 8 weeks, as well as heart weight/BW ratio (HW/BW) of 4-month-old WT and L613V/+ mice. (B) Cross-sections of cardiomyocytes (original magnification, ×400; scale bars: 100 μm). Cross-sectional area (numbers below) was measured in WGA-strained sections from 8 week-old mice (n = 5 samples per genotype, with 200 cells counted per sample using ImageJ). (C) Representative echocardiograms of hearts from 4-month-old mice. Arrows indicate LV diastolic dimension. (D) LVPWd at 2 and 4 months, measured by echocardiography. n = 13 (WT); 11 (L613V/+). (E) LVIDd and LVIDs of 2- and 4-month-old WT (n = 13) and L613V/+ (n = 11) hearts. (F) Cardiac contractility of 4-month-old WT (n = 13) and L613V/+ (n = 11) hearts, as measured by invasive hemodynamic analysis. (G) Myh6 and Myh7 gene expression in 4-month-old WT (n = 6) and L613V/+ (n = 9) hearts, assessed by quantitative real-time PCR. (B, D, and EG) *P < 0.05, **P < 0.005, ***P < 0.0001, 2-tailed Student’s t test.
Figure 4
Figure 4. Abnormal response of L613V/+ mice to pressure overload.
(A) Survival curves of WT (n = 25) and L613V/+ (n = 24) mice after TAC. **P < 0.005, log-rank test. (B) Gross appearance of hearts and heart weight/BW ratio at 8 weeks after TAC or sham surgery. Dashed outlines demonstrate markedly enlarged left atrium in L613V/+ compared with WT mice. **P < 0.005, ***P < 0.0001, Bonferroni post-test when ANOVA was significant; ##P < 0.005, 1-tailed Student’s t test. (C) Severe interstitial fibrosis in L613V/+ hearts (PSR staining; original magnification, ×100) at 8 weeks after TAC. Percent pixels staining positive with PSR for interstitial fibrosis was quantified using ImageJ. n = 14 (WT); 13 (L613V/+). ***P < 0.0001, Bonferroni post-test when ANOVA was significant; #P < 0.05, 2-tailed Student’s t test. (D) Perivascular fibrosis in hearts (PSR staining; original magnification, ×200) at 8 weeks after TAC. Similar results were obtained when Masson Trichrome stain was used to assess fibrosis.
Figure 5
Figure 5. Echocardiographic and hemodynamic parameters in WT and L613V/+ mice following pressure overload.
(A) LVPWd at 8 weeks after TAC or sham surgery. (B) Decreased SV and FS in L613V/+ mice after TAC. (C) Decreased cardiac contractility in L613V/+ mice after TAC. Because LVPs were not identical in WT and L613V/+ mice (see Table 3), both dP/dtmax and dP/dt@LVP40 are shown. *P < 0.05, **P < 0.005, ***P < 0.0001, Bonferroni post-test when ANOVA was significant; ##P < 0.005, ###P < 0.0001, 1-tailed Student’s t test. n = 12 (WT sham); 11 (L613V/+ sham); 22 (WT TAC); 13 (L613V/+ TAC).
Figure 6
Figure 6. Raf1L613V mutant increases Mek and Erk activation in cardiomyocytes.
Cardiomyocytes prepared from neonatal WT and L613V/+ mice were starved for 24 hours and then stimulated for the indicated number of minutes with 1 μg/ml Ang II (A), 10 ng/ml IL-6 (B), and 100 ng/ml heregulin-β1 (C). Cell lysates (15 μg protein) were immunoblotted with the indicated antibodies. Quantification of blots is also shown. 1 of 2 experiments with comparable results is shown.
Figure 7
Figure 7. Raf1L613V mutant increases Mek and Erk activation in cardiac fibroblasts.
Cardiac fibroblasts prepared from neonatal WT and L613V/+ mice were starved for 16 hours and then stimulated for the indicated number of minutes with 50 ng/ml EGF (A), 100 ng/ml IGF-I (B), 100 ng/ml PDGF (C), and 50 ng/ml FGF2 (D). Cell lysates (20 μg protein) were immunoblotted with the indicated antibodies. Quantification of blots is also shown. 1 of 2 experiments with comparable results is shown.
Figure 8
Figure 8. Enhanced Mek and Erk activation in L613V/+ hearts after pressure overload.
Hearts from WT and L613V/+ mice were subjected to TAC for the indicated number of minutes (n = 5 per group per time point), then lysed and analyzed by immunoblotting with the indicated antibodies. Erk2 levels are shown as a loading control. Each lane represents an individual animal; quantification of all samples is also shown. (A) Mek activation, with all samples from a single time point analyzed on the same gel. (B) Representative samples of Erk activation from each time point analyzed on the same gel. (A and B) *P < 0.05, 2-tailed Student’s t test.
Figure 9
Figure 9. MEK inhibitor treatment rescues growth defect and cardiac hypertrophy in L613V/+ mice.
Mice were injected i.p. daily with PD0325901 (PD; 5 mg/kg BW) or vehicle, starting at 4 weeks of age and for the succeeding 6 weeks. Body length (A) and BW (B) were measured weekly. Note the rapid normalization of body length, as well as the increase in BW caused by inhibitor treatment. #P < 0.05, ##P < 0.005, ###P < 0.0001, 2-way repeated-measures ANOVA; *P < 0.05, **P < 0.005, ***P < 0.0001, Bonferroni post-test when ANOVA was significant (black symbols, WT PD vs. WT control; red symbols, L613V/+ PD vs. L613V/+ control). (C) Heart weight/BW ratio and (D) LVPWd were restored to within normal limits in inhibitor-treated mice. **P < 0.005, ***P < 0.0001, Bonferroni post-test when ANOVA was significant; #P < 0.05, 1-tailed Student’s t test. (E) LVIDd. **P < 0.005, Bonferroni post-test when ANOVA was significant; #P < 0.05, ##P < 0.005, 1-tailed Student’s t test. n = 14 (WT); 10 (L613V/+); 6 (WT PD); 14 (L613V/+ PD). (F) Cross-sectional area of cardiomyocytes (original magnification, ×400; scale bar, 100 μm), measured in WGA-strained heart sections (n = 2 samples per group, with 200 cells counted per sample using ImageJ). ***P < 0.0001, Bonferroni post-test when ANOVA was significant. See also Supplemental Figure 6.
Figure 10
Figure 10. MEK inhibitor treatment normalizes cardiac function in L613V/+ mice.
(A) Echocardiographic parameters of hearts after treatment with PD0325901 as described in Figure 9. Note normalization of SV and FS, with a trend toward CO normalization. *P < 0.05, **P < 0.005, ***P < 0.0001, Bonferroni post-test when ANOVA was significant; #P < 0.05, 1-tailed Student’s t test. (B) Hemodynamic parameters, assessed by cardiac catheterization, after PD0325901 treatment. For calculating statistical significance, significant outliers (circled data points), as assessed by Grubbs test, were removed. *P < 0.05, Bonferroni post-test when ANOVA was significant (P = 0.09 including outliers); #P < 0.05, 1-tailed Student’s t test (P = 0.12 including outliers). n = 14 (WT); 10 (L613V/+); 6 (WT PD); 14 (L613V/+ PD).
Figure 11
Figure 11. Early postnatal MEK inhibitor treatment rescues facial dysmorphia in L613V/+ mice.
Lactating female mice were injected i.p. daily with PD0325901 (5 mg/kg BW) or vehicle, starting at P0 until weaning at P21. Weaned mice were then injected i.p. individually with PD0325901 (5 mg/kg BW) or vehicle daily for another 5 weeks. (A) Gross facial appearance. (B) Morphometric measurements of skulls from μCT scans. ICD, inner canthal distance. **P < 0.005, ***P < 0.0001, Bonferroni post-test when ANOVA was significant. n = 11 (WT); 10 (L613V/+); 6 (WT PD); 7 (L613V/+ PD).

Comment in

Similar articles

Cited by

References

    1. Dorn GW 2nd, Force T. Protein kinase cascades in the regulation of cardiac hypertrophy. J Clin Invest. 2005;115(3):527–537. - PMC - PubMed
    1. Heineke J, Molkentin JD. Regulation of cardiac hypertrophy by intracellular signalling pathways. Nat Rev Mol Cell Biol. 2006;7(8):589–600. - PubMed
    1. Haider AW, Larson MG, Benjamin EJ, Levy D. Increased left ventricular mass and hypertrophy are associated with increased risk for sudden death. J Am Coll Cardiol. 1998;32(5):1454–1459. doi: 10.1016/S0735-1097(98)00407-0. - DOI - PubMed
    1. Berenji K, Drazner MH, Rothermel BA, Hill JA. Does load-induced ventricular hypertrophy progress to systolic heart failure? Am J Physiol Heart Circ Physiol. 2005;289(1):H8–H16. doi: 10.1152/ajpheart.01303.2004. - DOI - PubMed
    1. Schoenfeld JR, et al. Distinct molecular phenotypes in murine cardiac muscle development, growth, and hypertrophy. J Mol Cell Cardiol. 1998;30(11):2269–2280. doi: 10.1006/jmcc.1998.0787. - DOI - PubMed

Publication types

Substances