The Epstein-Barr Virus BART microRNAs target the pro-apoptotic protein Bim
- PMID: 21333317
- PMCID: PMC3340891
- DOI: 10.1016/j.virol.2011.01.028
The Epstein-Barr Virus BART microRNAs target the pro-apoptotic protein Bim
Abstract
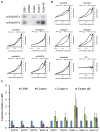
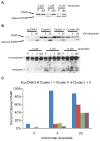
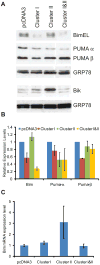
In Epstein-Barr Virus infected epithelial cancers, the alternatively spliced BamHI A rightward transcripts (BARTs) are abundantly expressed and are the template for two large clusters of miRNAs. This study indicates that both of these clusters independently can inhibit apoptosis in response to etoposide in an epithelial cell line. The Bcl-2 interacting mediator of cell death (Bim) was identified using gene expression microarrays and bioinformatic analysis indicated multiple potential binding sites for several BART miRNAs in the Bim 3'UTR. Bim protein was reduced by Cluster I and the individual expression of several miRNAs, while mRNA levels were unaffected. In reporter assays, the Bim 3' untranslated region (UTR) was inhibited by both clusters but not by any individual miRNAs. These results are consistent with the BART miRNAs downregulating Bim post-transcriptionally in part through the 3'UTR and suggest that there are miRNA recognition sites within other areas of the Bim mRNA.
Copyright © 2011 Elsevier Inc. All rights reserved.
Figures


Similar articles
-
Host Gene Expression Is Regulated by Two Types of Noncoding RNAs Transcribed from the Epstein-Barr Virus BamHI A Rightward Transcript Region.J Virol. 2015 Nov;89(22):11256-68. doi: 10.1128/JVI.01492-15. Epub 2015 Aug 26. J Virol. 2015. PMID: 26311882 Free PMC article.
-
MiR-92a mediates AZD6244 induced apoptosis and G1-phase arrest of lymphoma cells by targeting Bim.Cell Biol Int. 2014 Apr;38(4):435-43. doi: 10.1002/cbin.10225. Epub 2014 Feb 12. Cell Biol Int. 2014. PMID: 24375836
-
NF-κB Signaling Regulates Expression of Epstein-Barr Virus BART MicroRNAs and Long Noncoding RNAs in Nasopharyngeal Carcinoma.J Virol. 2016 Jun 24;90(14):6475-88. doi: 10.1128/JVI.00613-16. Print 2016 Jul 15. J Virol. 2016. PMID: 27147748 Free PMC article.
-
Role of Viral and Host microRNAs in Immune Regulation of Epstein-Barr Virus-Associated Diseases.Front Immunol. 2020 Mar 3;11:367. doi: 10.3389/fimmu.2020.00367. eCollection 2020. Front Immunol. 2020. PMID: 32194570 Free PMC article. Review.
-
The role of miRNAs and EBV BARTs in NPC.Semin Cancer Biol. 2012 Apr;22(2):166-72. doi: 10.1016/j.semcancer.2011.12.001. Epub 2011 Dec 10. Semin Cancer Biol. 2012. PMID: 22178394 Free PMC article. Review.
Cited by
-
Virus-encoded microRNAs: an overview and a look to the future.PLoS Pathog. 2012 Dec;8(12):e1003018. doi: 10.1371/journal.ppat.1003018. Epub 2012 Dec 20. PLoS Pathog. 2012. PMID: 23308061 Free PMC article. Review.
-
Epstein-Barr virus-derived circular RNA LMP2A induces stemness in EBV-associated gastric cancer.EMBO Rep. 2020 Oct 5;21(10):e49689. doi: 10.15252/embr.201949689. Epub 2020 Aug 12. EMBO Rep. 2020. PMID: 32790025 Free PMC article.
-
The Epstein-Barr virus encoded BART miRNAs potentiate tumor growth in vivo.PLoS Pathog. 2015 Jan 15;11(1):e1004561. doi: 10.1371/journal.ppat.1004561. eCollection 2015 Jan. PLoS Pathog. 2015. PMID: 25590614 Free PMC article.
-
The emerging role of Epstein-Barr virus encoded microRNAs in nasopharyngeal carcinoma.J Cancer. 2018 Jul 30;9(16):2852-2864. doi: 10.7150/jca.25460. eCollection 2018. J Cancer. 2018. PMID: 30123354 Free PMC article. Review.
-
Oncogenic Viruses as Entropic Drivers of Cancer Evolution.Front Virol. 2021 Nov;1:753366. doi: 10.3389/fviro.2021.753366. Epub 2021 Nov 15. Front Virol. 2021. PMID: 35141704 Free PMC article.
References
-
- Anderton E, Yee J, Smith P, Crook T, White RE, Allday MJ. Two Epstein-Barr virus (EBV) oncoproteins cooperate to repress expression of the proapoptotic tumour-suppressor Bim: clues to the pathogenesis of Burkitt's lymphoma. Oncogene. 2008;27(4):421–33. - PubMed
-
- Barranco SC, Townsend CM, Jr, Casartelli C, Macik BG, Burger NL, Boerwinkle WR, Gourley WK. Establishment and characterization of an in vitro model system for human adenocarcinoma of the stomach. Cancer Res. 1983;43(4):1703–9. - PubMed
-
- Bartel DP. MicroRNAs: genomics, biogenesis, mechanism, and function. Cell. 2004;116(2):281–97. - PubMed
Publication types
MeSH terms
Substances
Grants and funding
LinkOut - more resources
Full Text Sources
Other Literature Sources

