

Profiling the effects of isocitrate dehydrogenase 1 and 2 mutations on the cellular metabolome
- PMID: 21289278
- PMCID: PMC3044380
- DOI: 10.1073/pnas.1019393108
Profiling the effects of isocitrate dehydrogenase 1 and 2 mutations on the cellular metabolome
Abstract
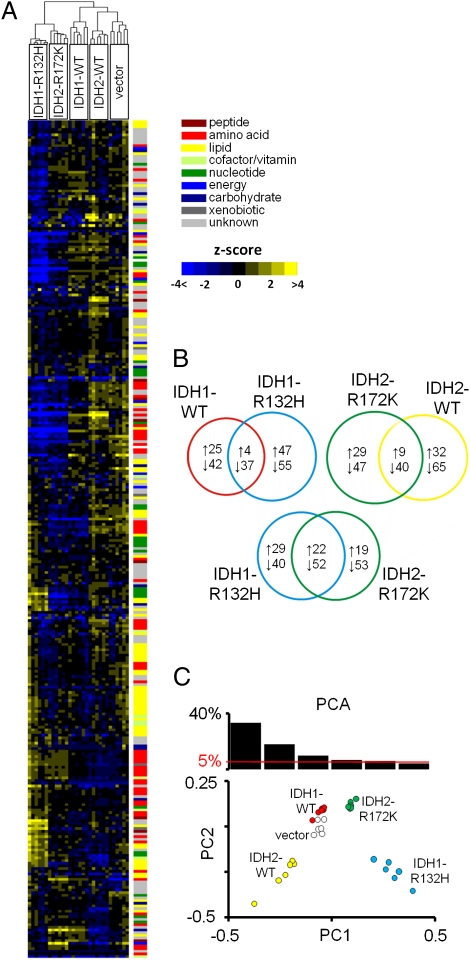
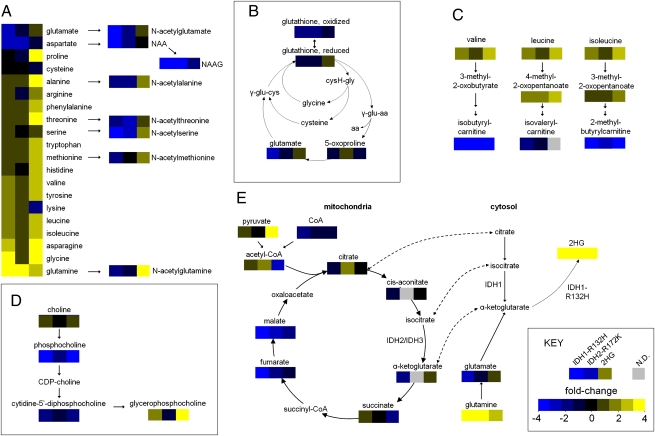
Point mutations of the NADP(+)-dependent isocitrate dehydrogenases 1 and 2 (IDH1 and IDH2) occur early in the pathogenesis of gliomas. When mutated, IDH1 and IDH2 gain the ability to produce the metabolite (R)-2-hydroxyglutarate (2HG), but the downstream effects of mutant IDH1 and IDH2 proteins or of 2HG on cellular metabolism are unknown. We profiled >200 metabolites in human oligodendroglioma (HOG) cells to determine the effects of expression of IDH1 and IDH2 mutants. Levels of amino acids, glutathione metabolites, choline derivatives, and tricarboxylic acid (TCA) cycle intermediates were altered in mutant IDH1- and IDH2-expressing cells. These changes were similar to those identified after treatment of the cells with 2HG. Remarkably, N-acetyl-aspartyl-glutamate (NAAG), a common dipeptide in brain, was 50-fold reduced in cells expressing IDH1 mutants and 8.3-fold reduced in cells expressing IDH2 mutants. NAAG also was significantly lower in human glioma tissues containing IDH mutations than in gliomas without such mutations. These metabolic changes provide clues to the pathogenesis of tumors associated with IDH gene mutations.
Conflict of interest statement
Conflict of interest statement: Under agreements between the Johns Hopkins University, Agios Pharmaceuticals, and Personal Genome Diagnostics, B.V. is entitled to a share of the royalties received by the University on sales of products related to IDH genes. B.V. is a cofounder of Personal Genome Diagnostics and is a member of its Scientific Advisory Board. B.V. also owns stock in Personal Genome Diagnostics, which is subject to certain restrictions under University policy. The terms of these arrangements are managed by the Johns Hopkins University in accordance with its conflict-of-interest policies.
Figures


Similar articles
-
2-hydroxyglutarate production, but not dominant negative function, is conferred by glioma-derived NADP-dependent isocitrate dehydrogenase mutations.PLoS One. 2011 Feb 4;6(2):e16812. doi: 10.1371/journal.pone.0016812. PLoS One. 2011. PMID: 21326614 Free PMC article.
-
Metabolomic comparison between cells over-expressing isocitrate dehydrogenase 1 and 2 mutants and the effects of an inhibitor on the metabolism.J Neurochem. 2015 Jan;132(2):183-93. doi: 10.1111/jnc.12950. Epub 2014 Nov 2. J Neurochem. 2015. PMID: 25251602
-
The potential for isocitrate dehydrogenase mutations to produce 2-hydroxyglutarate depends on allele specificity and subcellular compartmentalization.J Biol Chem. 2013 Feb 8;288(6):3804-15. doi: 10.1074/jbc.M112.435495. Epub 2012 Dec 21. J Biol Chem. 2013. PMID: 23264629 Free PMC article.
-
Isocitrate dehydrogenase 1 and 2 mutations in cancer: alterations at a crossroads of cellular metabolism.J Natl Cancer Inst. 2010 Jul 7;102(13):932-41. doi: 10.1093/jnci/djq187. Epub 2010 May 31. J Natl Cancer Inst. 2010. PMID: 20513808 Free PMC article. Review.
-
Development of Novel Therapeutics Targeting Isocitrate Dehydrogenase Mutations in Cancer.Curr Top Med Chem. 2018;18(6):505-524. doi: 10.2174/1568026618666180518091144. Curr Top Med Chem. 2018. PMID: 29773061 Review.
Cited by
-
Hyperpolarized (13)C MR imaging detects no lactate production in mutant IDH1 gliomas: Implications for diagnosis and response monitoring.Neuroimage Clin. 2016 Jun 23;12:180-9. doi: 10.1016/j.nicl.2016.06.018. eCollection 2016. Neuroimage Clin. 2016. PMID: 27437179 Free PMC article.
-
Genetically-defined metabolic reprogramming in cancer.Trends Endocrinol Metab. 2012 Nov;23(11):552-9. doi: 10.1016/j.tem.2012.06.009. Epub 2012 Jul 31. Trends Endocrinol Metab. 2012. PMID: 22858391 Free PMC article. Review.
-
Mutant IDH1 expression is associated with down-regulation of monocarboxylate transporters.Oncotarget. 2016 Jun 7;7(23):34942-55. doi: 10.18632/oncotarget.9006. Oncotarget. 2016. PMID: 27144334 Free PMC article.
-
2-hydroxyglutarate as a magnetic resonance biomarker for glioma subtyping.Transl Oncol. 2013 Apr;6(2):92-8. doi: 10.1593/tlo.12424. Epub 2013 Apr 1. Transl Oncol. 2013. PMID: 23544162 Free PMC article.
-
Dysregulation of fatty acid synthesis and glycolysis in non-Hodgkin lymphoma.Proc Natl Acad Sci U S A. 2012 Jul 17;109(29):11818-23. doi: 10.1073/pnas.1205995109. Epub 2012 Jun 29. Proc Natl Acad Sci U S A. 2012. PMID: 22752304 Free PMC article.
References
Publication types
MeSH terms
Substances
Grants and funding
LinkOut - more resources
Full Text Sources
Other Literature Sources
Miscellaneous
