Tumour microvesicles contain retrotransposon elements and amplified oncogene sequences
- PMID: 21285958
- PMCID: PMC3040683
- DOI: 10.1038/ncomms1180
Tumour microvesicles contain retrotransposon elements and amplified oncogene sequences
Abstract
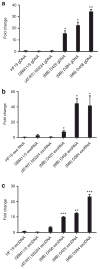
Tumour cells release an abundance of microvesicles containing a selected set of proteins and RNAs. Here, we show that tumour microvesicles also carry DNA, which reflects the genetic status of the tumour, including amplification of the oncogene c-Myc. We also find amplified c-Myc in serum microvesicles from tumour-bearing mice. Further, we find remarkably high levels of retrotransposon RNA transcripts, especially for some human endogenous retroviruses, such as LINE-1 and Alu retrotransposon elements, in tumour microvesicles and these transposable elements could be transferred to normal cells. These findings expand the nucleic acid content of tumour microvesicles to include: elevated levels of specific coding and non-coding RNA and DNA, mutated and amplified oncogene sequences and transposable elements. Thus, tumour microvesicles contain a repertoire of genetic information available for horizontal gene transfer and potential use as blood biomarkers for cancer.
Conflict of interest statement
Figures


Similar articles
-
Integration of maternal genome into the neonate genome through breast milk mRNA transcripts and reverse transcriptase.Theor Biol Med Model. 2012 Jun 7;9:20. doi: 10.1186/1742-4682-9-20. Theor Biol Med Model. 2012. PMID: 22676860 Free PMC article. Review.
-
The growth-inhibitory Ndrg1 gene is a Myc negative target in human neuroblastomas and other cell types with overexpressed N- or c-myc.Mol Cell Biochem. 2003 Aug;250(1-2):91-105. doi: 10.1023/a:1024918328162. Mol Cell Biochem. 2003. PMID: 12962147
-
Glioblastoma microvesicles transport RNA and proteins that promote tumour growth and provide diagnostic biomarkers.Nat Cell Biol. 2008 Dec;10(12):1470-6. doi: 10.1038/ncb1800. Epub 2008 Nov 16. Nat Cell Biol. 2008. PMID: 19011622 Free PMC article.
-
The gag coding region of the Drosophila telomeric retrotransposon, HeT-A, has an internal frame shift and a length polymorphic region.J Mol Evol. 1996 Dec;43(6):572-83. doi: 10.1007/BF02202105. J Mol Evol. 1996. PMID: 8995054
-
Brain tumor microvesicles: insights into intercellular communication in the nervous system.Cell Mol Neurobiol. 2011 Aug;31(6):949-59. doi: 10.1007/s10571-011-9697-y. Epub 2011 May 8. Cell Mol Neurobiol. 2011. PMID: 21553248 Free PMC article. Review.
Cited by
-
Expression of most retrotransposons in human blood correlates with biological aging.Elife. 2024 Oct 17;13:RP96575. doi: 10.7554/eLife.96575. Elife. 2024. PMID: 39417397 Free PMC article.
-
The detection, biological function, and liquid biopsy application of extracellular vesicle-associated DNA.Biomark Res. 2024 Oct 14;12(1):123. doi: 10.1186/s40364-024-00661-2. Biomark Res. 2024. PMID: 39402599 Free PMC article. Review.
-
Extracellular vesicle-associated DNA: ten years since its discovery in human blood.Cell Death Dis. 2024 Sep 12;15(9):668. doi: 10.1038/s41419-024-07003-y. Cell Death Dis. 2024. PMID: 39266560 Free PMC article. Review.
-
The evolutionary theory of cancer: challenges and potential solutions.Nat Rev Cancer. 2024 Oct;24(10):718-733. doi: 10.1038/s41568-024-00734-2. Epub 2024 Sep 10. Nat Rev Cancer. 2024. PMID: 39256635 Review.
-
Intercellular Molecular Transfer Mediated by Extracellular Vesicles in Cancer.Results Probl Cell Differ. 2024;73:327-352. doi: 10.1007/978-3-031-62036-2_14. Results Probl Cell Differ. 2024. PMID: 39242385 Review.
References
-
- Novakova J, Slaby O, Vyzula R, Michalek J. MicroRNA involvement in glioblastoma pathogenesis. Biochem Biophys Res Commun. 2009;386:1–5. - PubMed
-
- Kristensen LS, Hansen LL. PCR-based methods for detecting single-locus DNA methylation biomarkers in cancer diagnostics, prognostics, and response to treatment. Clin Chem. 2009;55:1471–1483. - PubMed
Publication types
MeSH terms
Substances
Associated data
- Actions
Grants and funding
LinkOut - more resources
Full Text Sources
Other Literature Sources

