. 2011 Jan 14;6(1):e14535.
doi: 10.1371/journal.pone.0014535.

Rapamycin blocks production of KSHV/HHV8: insights into the anti-tumor activity of an immunosuppressant drug

Affiliations

Rapamycin blocks production of KSHV/HHV8: insights into the anti-tumor activity of an immunosuppressant drug

Lisa A Nichols et al. PLoS One. .

Abstract

Background: Infection with Kaposi's sarcoma-associated herpesvirus (KSHV/HHV8) often results in the development of fatal tumors in immunocompromised patients. Studies of renal transplant recipients show that use of the immunosuppressant drug rapamycin, an mTOR inhibitor, both prevents and can induce the regression of Kaposi's sarcoma (KS), an opportunistic tumor that arises within a subset of this infected population. In light of rapamycin's marked anti-KS activity, we tested whether the drug might directly inhibit the KSHV life cycle. We focused on the molecular switch that triggers this predominantly latent virus to enter the lytic (productive) replication phase, since earlier work links this transition to viral persistence and tumorigenesis.

Methods and findings: In latently infected human B cell lines, we found that rapamycin inhibited entry of the virus into the lytic replication cycle, marked by a loss of expression of the lytic switch protein, replication and transcription activator (RTA). To test for viral-specific effects of rapamycin, we focused our studies on a B cell line with resistance to rapamycin-mediated growth inhibition. Using this line, we found that the drug had minimal effect on cell cycle profiles, cellular proliferation, or the expression of other cellular or latent viral proteins, indicating that the RTA suppression was not a result of global cellular dysregulation. Finally, treatment with rapamycin blocked the production of progeny virions.

Conclusions: These results indicate that mTOR plays a role in the regulation of RTA expression and, therefore, KSHV production, providing a potential molecular explanation for the marked clinical success of rapamycin in the treatment and prevention of post-transplant Kaposi's sarcoma. The striking inhibition of rapamycin on KSHV lytic replication, thus, helps explain the apparent paradox of an immunosuppressant drug suppressing the pathogenesis of an opportunistic viral infection.


Conflict of interest statement

Competing Interests: The authors have declared that no competing interests exist.

Figures

Figure 1
Figure 1. Rapamycin blocks S6K phosphorylation in BCBL-1 cells, but does not block cell cycle progression.
(A) DNA content analysis of BCBL-1 cells treated with rapamycin (0.12 nM, 12 nM, 120 nM) or DMSO vehicle control was determined by PI staining (representative experiment of n≥3). (B) Graph of percentage of cells in either the G1, S, G2 subset as determined using the Modfit LT analysis software. (C) BCBL-1 cells treated with rapamycin at indicated doses. At 48 hours post-treatment, whole cell extracts were immunoblotted for mTOR, S6K phosphorylated at Thr389, and S6K.
Figure 2
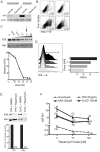
Figure 2. Rapamycin inhibits spontaneous and induced RTA expression in a dose-dependent manner regardless of induction pathway.
BCBL-1 were treated with 120 nM rapamycin or vehicle for 2 h, and then without (uninduced) or with 0.6 mM VPA (induced). (A) 48 h post-treatment, nuclear extracts were analyzed by immunoblot for RTA expression using the nuclear protein, RCC1, as a loading control. Representative experiment, n = 3. (B) 48 h post-rapamycin, uninduced BCBL-1 cells (top panels) or VPA-induced (bottom panels) were harvested, treated with a dead cell stain, then fixed, stained for intracellular RTA, and analyzed by flow cytometry. Representative plots (n = 7) show RTA expression in live-gated BCBL-1 cells treated with vehicle (left panels) or rapamycin (right panels). (C) Nuclear extracts were analyzed for RTA expression using non-enzymatic infrared detection probes to quantify relative protein levels. Ran (ras-related nuclear protein) was used as loading control. Graph (C, bottom panel) shows immunoblot RTA levels normalized to Ran as a percentage of RTA levels in the vehicle (DMSO) treated control. Representative experiment (n = 2). (D) Induced BCBL-1 cells treated for 48 h with rapamycin at indicated doses were fixed, stained for intracellular RTA and analyzed by flow cytometry. Graph, right, shows percent of RTA+ cells in population indicated by histogram gate. (E) BCBL1 48 h post-treatment cells were harvested and nuclear extracts immunoblotted for RTA and normalized to Ran. Graph shows quantification of bands using non-enzymatic infrared detection probes. Representative experiment (n = 2). (E) BCBL-1 treated with indicated doses of rapamycin and left uninduced (square, dashed line), or induced with either VPA (triangle, solid line), TPA (triangle, dashed line), or CoCl2 (open triangle, solid line) were cultured for 48 hrs in presence of rapamycin, then stained with intracellular RTA. Graph shows percentage of RTA+ cells in live cell population. Mean ± s.e.m.; n for each condition shown in parentheses.
Figure 3
Figure 3. Rapamycin treatment significantly decreases induction of lytic KSHV proteins.
(A) BCBL-1 cells were pre-treated for 2 hours with rapamycin (12 nM), then induced, in the presence of rapamycin with either CoCl2 or TPA. (A) BCBL-1 cells were pre-treated for 2 hours with rapamycin 120 nM or DMSO vehicle control two hours prior to induction with CoCl2 (200 mM), TPA (20 ng/mL) or VPA (600 µM). Nuclear extracts were analyzed by immunoblot for HIF1α expression 24 hours (left), or vIRF3 expression (middle) or LANA expression (right) 48 hours post-treatment. (B) Uninduced or VPA-induced BCBL-1 cells were harvested 48 h post-rapamycin treatment (12 nM), then fixed and stained with antibodies against ORF59, K8.1 and LANA. Leftmost set of dot plots show ORF59 staining on representative samples from uninduced (left panels) and induced (right panels) BCBL-1 cells treated with either vehicle (top panels) or rapamycin (bottom panels). Similar data was collected for both K8.1 and LANA expression. Graphs depict results from multiple replicates of these experiments and indicate the percent of live-gated cells positive for indicated protein stain; horizontal lines depict the mean of replicates (individual circles). Numbers above graph depict p values of comparisons.
Figure 4
Figure 4. RTA regulation by rapamycin is mediated at both the mRNA and protein level.
Messenger ORF50 RNA and RTA protein levels were assessed in BCBL-1 pre-treated with rapamycin for 2 hours, and then induced to lytic reactivation using VPA, TPA, or CoCl2. Samples were collected at 0, 6, 24, and 48 hours post-treatment. (A) Top panel, nuclear extracts were used to determine RTA protein levels at each time point using non-enzymatic, immunoblot quantification and normalization to Ran. Graphs show mean ± s.e.m. of triplicate experiments for DMSO (solid line) and rapamycin-treated (dashed line) samples. Individual experiments were normalized to the maximal protein expression levels in DMSO sample at 48 h post-induction. Bottom panel, total mRNA was also collected for quantitative RT-PCR analysis of ORF50 mRNA from parallel whole lysate samples. Graph shows pooled data from 3 experiments with DMSO (solid line) and rapamycin-treated (dashed line) cultures shown. Means ± s.e.m. (B) BCBL-1 cells treated with rapamycin (dashed lines) or DMSO (solid lines) were induced with either TPA (left panels) or CoCl2 (right panels). RTA protein levels (top) and mRNA levels (bottom) are shown from representative experiments. (C) For each timepoint and induction, viability was determined for both DMSO (black bar) and rapamycin-treated (gray bar) samples by staining an aliquot from each culture with a live/dead exclusion dye and assessing for dye uptake (cell death) by flow cytometry. Graphs show % viable, mean ± s.e.m. of triplicates.
Figure 5
Figure 5. Virion production is significantly decreased by rapamycin treatment.
BCBL-1 +/− rapamycin 12 nM were induced with CoCl2, TPA, or VPA. Five days post-induction, virus was concentrated from supernatants. HeLa cells were then infected with concentrated virus in the presence of polybrene. Viral titers were determined by staining HeLa cells for punctate intranuclear LANA dots and analyzing via multispectral imaging flow cytometry. (A) Images show representative nuclear staining with DRAQ5 (Nuc.), LANA antibody stain, and the overlay (Comb.). Upper panel shows three representative HeLa cells infected with inoculum from untreated VPA-induced BCBL-1. Lower panel shows representative HeLas infected with inoculum from rapamycin-treated VPA-induced cells. (B) Graph of viral titers untreated (black bars) or treated with rapamycin (gray bars) for each indicated inducting agent. Representative experiment, n = 2. (C) Inhibition of cell-to-cell virus transmission from spontaneously lytic BCBL-1 was assessed by culture of BCBL-1 in the presence of 12 nM rapamycin for 2 days. Cells were then harvested, placed in fresh media without rapamycin and co-cultured with HeLa cells for 24 h. BCBL-1 cells were removed, HeLa cells washed x 2 to remove non-adherent BCBL-1 cells, and cultured an additional 24 h before harvest. Adherent HeLa cells were trypsinized, fixed and stained for intranuclear LANA dots. LANA+ HeLa cells were analyzed by MIFC. Graph shows percentage (mean ± s.d.) of infected cells from triplicate cultures for HeLa cells co-cultured with either rapamycin-treated (gray) or DMSO-treated (black) BCBL-1. ** p<0.01.

Similar articles

Cited by

References

    1. Moore PS, Chang Y. Molecular virology of Kaposi's sarcoma-associated herpesvirus. Philosophical Transactions of the Royal Society of London Series B-Biological Sciences. 2001;356:499–516. - PMC - PubMed
    1. Moore PS, Gao SJ, Dominguez G, Cesarman E, Lungu O, et al. Primary characterization of a herpesvirus agent associated with Kaposi's sarcoma. Journal of Virology. 1996;70:549–558. - PMC - PubMed
    1. Grundhoff A, Ganem D. Inefficient establishment of KSHV latency suggests an additional role for continued lytic replication in Kaposi sarcoma pathogenesis. J Clin Invest. 2004;113:124–136. - PMC - PubMed
    1. Casper C, Nichols WG, Huang ML, Corey L, Wald A. Remission of HHV-8 and HIV-associated multicentric Castleman disease with ganciclovir treatment. Blood. 2004;103:1632–1634. - PubMed
    1. Lukac DM, Kirshner JR, Ganem D. Transcriptional activation by the product of open reading frame 50 of Kaposi's sarcoma-associated herpesvirus is required for lytic viral reactivation in B cells. J Virol. 1999;73:9348–9361. - PMC - PubMed

Publication types

MeSH terms

LinkOut - more resources