Cellular gene expression that correlates with EBER expression in Epstein-Barr Virus-infected lymphoblastoid cell lines
- PMID: 21248031
- PMCID: PMC3067860
- DOI: 10.1128/JVI.02086-10
Cellular gene expression that correlates with EBER expression in Epstein-Barr Virus-infected lymphoblastoid cell lines
Abstract
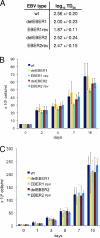
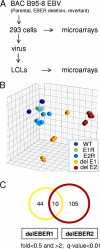
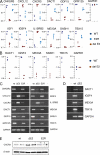
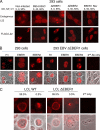
Novel Epstein-Barr Virus (EBV) strains with deletion of either EBER1 or EBER2 and corresponding revertant viruses were constructed and used to infect B lymphocytes to make lymphoblastoid cell lines (LCLs). The LCLs were used in microarray expression profiling to identify genes whose expression correlates with the presence of EBER1 or EBER2. Functions of regulated genes identified in the microarray analysis include membrane signaling, regulation of apoptosis, and the interferon/antiviral response. Although most emphasis has previously been given to EBER1 because it is more abundant than EBER2, the differences in cell gene expression were greater with EBER2 deletion. In this system, deletion of EBER1 or EBER2 had little effect on the EBV transformation frequency of primary B cells or the growth of the resulting LCLs. Using the recombinant viruses and novel EBER expression vectors, the nuclear redistribution of rpL22 protein by EBER1 in 293 cells was confirmed, but in LCLs almost all of the cells had a predominantly cytoplasmic expression of this ribosomal protein, which was not detectably changed by EBER1. The changes in LCL gene expression identified here will provide a basis for identifying the mechanisms of action of EBER RNAs.
Figures


Similar articles
-
Epstein-Barr virus (EBV)-encoded RNA 2 (EBER2) but not EBER1 plays a critical role in EBV-induced B-cell growth transformation.J Virol. 2007 Oct;81(20):11236-45. doi: 10.1128/JVI.00579-07. Epub 2007 Aug 8. J Virol. 2007. PMID: 17686859 Free PMC article.
-
Proteomics and Transcriptomics of BJAB Cells Expressing the Epstein-Barr Virus Noncoding RNAs EBER1 and EBER2.PLoS One. 2015 Jun 29;10(6):e0124638. doi: 10.1371/journal.pone.0124638. eCollection 2015. PLoS One. 2015. PMID: 26121143 Free PMC article.
-
Consideration of Epstein-Barr Virus-Encoded Noncoding RNAs EBER1 and EBER2 as a Functional Backup of Viral Oncoprotein Latent Membrane Protein 1.mBio. 2016 Jan 19;7(1):e01926-15. doi: 10.1128/mBio.01926-15. mBio. 2016. PMID: 26787829 Free PMC article.
-
Modulation of innate immunity system by Epstein-Barr virus-encoded non-coding RNA and oncogenesis.Cancer Sci. 2010 Jan;101(1):29-35. doi: 10.1111/j.1349-7006.2009.01377.x. Epub 2009 Sep 29. Cancer Sci. 2010. PMID: 19886912 Free PMC article. Review.
-
The labyrinth of interactions of Epstein-Barr virus-encoded small RNAs.Rev Med Virol. 2014 Jan;24(1):3-14. doi: 10.1002/rmv.1763. Epub 2013 Sep 18. Rev Med Virol. 2014. PMID: 24105992 Review.
Cited by
-
The Epstein-Barr virus noncoding RNA EBER2 transactivates the UCHL1 deubiquitinase to accelerate cell growth.Proc Natl Acad Sci U S A. 2021 Oct 26;118(43):e2115508118. doi: 10.1073/pnas.2115508118. Proc Natl Acad Sci U S A. 2021. PMID: 34686609 Free PMC article.
-
Epstein-Barr virus infection induces aberrant TLR activation pathway and fibroblast-myofibroblast conversion in scleroderma.J Invest Dermatol. 2014 Apr;134(4):954-964. doi: 10.1038/jid.2013.423. Epub 2013 Oct 11. J Invest Dermatol. 2014. PMID: 24129067 Free PMC article.
-
Epstein-Barr virus-encoded small RNAs (EBERs) are present in fractions related to exosomes released by EBV-transformed cells.PLoS One. 2014 Jun 4;9(6):e99163. doi: 10.1371/journal.pone.0099163. eCollection 2014. PLoS One. 2014. PMID: 24896633 Free PMC article.
-
Non-Coding RNAs: Strategy for Viruses' Offensive.Noncoding RNA. 2020 Sep 10;6(3):38. doi: 10.3390/ncrna6030038. Noncoding RNA. 2020. PMID: 32927786 Free PMC article. Review.
-
Genome diversity of Epstein-Barr virus from multiple tumor types and normal infection.J Virol. 2015 May;89(10):5222-37. doi: 10.1128/JVI.03614-14. Epub 2015 Mar 18. J Virol. 2015. PMID: 25787276 Free PMC article.
References
-
- Anderson, S. J., et al. 2007. Ablation of ribosomal protein L22 selectively impairs αβ T cell development by activation of a p53-dependent checkpoint. Immunity 26:759-772. - PubMed
-
- Brummelkamp, T. R., R. Bernards, and R. Agami. 2002. A system for stable expression of short interfering RNAs in mammalian cells. Science 296:550-553. - PubMed
Publication types
MeSH terms
Substances
LinkOut - more resources
Full Text Sources

