. 2011 Mar 17;117(11):3113-22.
doi: 10.1182/blood-2010-10-312926. Epub 2011 Jan 12.

The host genomic environment of the provirus determines the abundance of HTLV-1-infected T-cell clones

Affiliations

The host genomic environment of the provirus determines the abundance of HTLV-1-infected T-cell clones

Nicolas A Gillet et al. Blood. .

Abstract

Human T-lymphotropic virus type 1 (HTLV-1) persists by driving clonal proliferation of infected T lymphocytes. A high proviral load predisposes to HTLV-1-associated diseases. Yet the reasons for the variation within and between persons in the abundance of HTLV-1-infected clones remain unknown. We devised a high-throughput protocol to map the genomic location and quantify the abundance of > 91,000 unique insertion sites of the provirus from 61 HTLV-1(+) persons and > 2100 sites from in vitro infection. We show that a typical HTLV-1-infected host carries between 500 and 5000 unique insertion sites. We demonstrate that negative selection dominates during chronic infection, favoring establishment of proviruses integrated in transcriptionally silenced DNA: this selection is significantly stronger in asymptomatic carriers. We define a parameter, the oligoclonality index, to quantify clonality. The high proviral load characteristic of HTLV-1-associated inflammatory disease results from a larger number of unique insertion sites than in asymptomatic carriers and not, as previously thought, from a difference in clonality. The abundance of established HTLV-1 clones is determined by genomic features of the host DNA flanking the provirus. HTLV-1 clonal expansion in vivo is favored by orientation of the provirus in the same sense as the nearest host gene.


Figures

Figure 1
Figure 1
UIS mapping and quantification of abundance. (A) Genomic DNA was extracted from PBMCs and sonicated. The end of the 3′-long terminal repeat and a fragment of genomic DNA were amplified by ligation-mediated PCR and the products sequenced on an Illumina Genome Analyser. (B) In this example, a genomic DNA sample contains 4 proviral copies from infected T-cell clone X and 1 copy from clone Y. Because the DNA shear site is random, the amplicon from each cell in clone X has a different shear site. The abundance of each UIS is quantified by counting the number of different shear sites for that UIS.
Figure 2
Figure 2
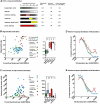
HTLV-1 clonal structure in naturally infected patients. (A) The clonal distribution in each genomic DNA sample is depicted by a histogram. Each segment represents one UIS; the width of the segment is proportional to the relative abundance of that UIS. The 3 most abundant UISs are colored. (B) The OCI did not correlate with PVL in ACs or in patients with HAM/TSP, but this correlation was significant in patients with ATLL (Spearman rank, P = .0065, R = 0.57). The mean coefficient of variation of OCI was 4.3% (N = 11 samples). The OCI was greater in patients with ATLL than in patients with nonmalignant HTLV-1 infection (box-plot insert, Mann-Whitney, P < .0001). (C) The total number of UISs calculated using the Chao1-bc estimator. The total number of UISs correlated positively with PVL, both in ACs (Spearman rank, P = .035, R = 0.50) and in patients with HAM/TSP (Spearman rank, P = .003, R = 0.57). The mean coefficient of variation of Chao1-bc estimator was 9.5% (N = 11 samples). The adjacent box-plot shows that the number of UISs was significantly greater in patients with HAM/TSP than in ACs (unpaired t test with Welch correction, P = .0002). (D) Low-abundance UISs made up the large majority of all UISs, regardless of disease status. Only ATLL patients had very large UISs (right-hand extremity of the curve). The relative frequency distribution of UIS abundance in ATLL patients showed a shift to the right: asterisks denote the significance of the difference in the proportion of UISs at a given abundance between ATLL patients and ACs (χ2 test). (E) ACs had fewer UISs in each abundance category compared with patients with HAM/TSP: asterisks denote the significance of the difference in the mean number of UISs of a given abundance between patients with HAM/TSP and ACs (Mann-Whitney). ***P < .001. **P < .01. *P < .05. NS indicates not significant (P > .05).
Figure 3
Figure 3
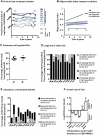
Temporal evolution of HTLV-1 clonal structure in natural infection. (A) Proviral load in PBMCs in 11 patients during follow-up for 5 to 9 years. (B) Clonality analysis was made in triplicate at time 1 (t1, A, □) and time 2 (t2, A, ○). Oligoclonality index increased with time in patients with nonmalignant infection (paired t test, P = .017). In March 2007, the oligoclonality index of patient TBK (black line) reached the range typical of ATLL (Figure 2A-B) and lymphoma-type ATLL was subsequently diagnosed in June 2009. (C) □ represents the percentage of the PVL at time 1 that was constituted by UISs, which were detected again at time 2; and ○, the percentage of PVL at time 2 constituted by UISs that had been detected at time 1. (D) The majority of large UISs (those that constituted the top quartile of the PVL) at time 2 were already large (top quartile of PVL) at time 1 (solid black bars). (E) Newly detected UISs at time 2 were mainly small UISs (black fraction of the bars) and on average made up less than 20% of the total PVL. (F) Temporal variation in UIS abundance. S1 represents the abundance of a given UIS at time 1; and S2, the abundance at time 2. Low-abundance UISs became less abundant, whereas high-abundance UISs grew. Asterisks denote the significance of difference of the observed ratio (S1/S2) from 1.0 (t test). Sample size: 0.1 and below, n = 3979; 0.1 to 1, n = 12 463; 1 to 5, n = 1016; 5 to 10, n = 52; and 10 and above, n = 21. ***P < .001. *P < .05. NS indicates not significant (P > .05).
Figure 4
Figure 4
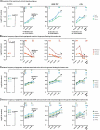
Genetic and epigenetic environment around the proviral insertion site. UISs identified in vivo were organized according to the disease status of the subject (AC, HAM/TSP, and ATLL) and UIS abundance (number of UISs per 10 000 PBMCs). In the ATLL category, the last column named “Major UIS” referred to the most abundant UIS in each person (ie, the proviral insertion site present in the putative malignant clone). “In vitro” refers to insertion sites isolated after coculture of uninfected T cells with an HTLV-1–infected cell line. The y-axis represents the departure from the random distribution. The in vitro results were compared with sites that were randomly generated in silico (horizontal asterisks below “vs random”). The UISs of lowest and highest abundance in each disease status group were compared with the in vitro sites (vertical asterisks to the right of “vs in vitro”). The trends associated with the UIS abundance were also tested for significance (asterisks below the black arrows). (A) “Pr” is the proportion of insertion sites lying within 10 kb of a CpG island or a RefSeq gene. Enrichment toward a given mark is calculated as the log ratio of “Pr” over “Pr random” (proportion expected in case of perfect random integration). Insertion sites isolated in vitro were enriched in the vicinity of CpG islands and genes compared with random (χ2 test). Increasing UIS abundance was correlated with proximity to CpG islands and genes (χ2 test for trend). The UISs of lowest abundance in each disease group were significantly less frequently integrated near CpG islands and genes than were the in vitro sites (χ2 test). (B-D) “N” is the number of a given epigenetic mark in a 10-kb window (± 5 kb) around the insertion site. “N random” is the number of that mark in the case of perfectly randomly distributed insertion sites. Enrichment of a given epigenetic mark was calculated as log (N/N random). In vitro insertion sites were found to lie in an environment enriched for both active and repressive epigenetic marks compared with random (B-D; unpaired t test with Welch correction). UIS abundance was negatively correlated with the density of gene-silencing marks (B, Pearson correlation test). UIS abundance was positively correlated with the density of marks associated with active transcription start sites (TSS), promoters, and transcribed units (C-D, Pearson correlation test). The UISs of highest abundance in each disease group were less frequently associated with gene-silencing marks than were the UISs in vitro (panel B, unpaired t test with Welch correction). The UISs of lowest abundance were less frequently associated with activating marks than the in vitro sites (C-D, unpaired t test with Welch correction). Sample size: In vitro, n = 2135; AC < 0.1, n = 4544; AC 0.1 to 1, n = 8649; AC 1 to 10, n = 727; HAM-TSP < 0.1, n = 26 200; HAM-TSP 0.1 to 1, n = 36 377; HAM-TSP 1 to 10, n = 2931; HAM-TSP > 10, n = 39; ATLL 0.1 to 1, n = 9827; ATLL 1 to 10, n = 1659; ATLL > 10, n = 69; ATLL major UIS, n = 19. ***P < .001. **P < .01. *P < .05. NS indicates not significant (P > .05).
Figure 5
Figure 5
Frequency of proviral insertion in genes and relative orientation of the provirus. (A) The proportion of proviruses inserted inside a RefSeq gene increased with UIS abundance (asterisks below the open black triangle; χ2 test for trend). In low-abundance UISs, the proportion of proviruses inserted inside a gene was smaller than in UISs identified in vitro (vertical asterisks to the right of “vs in vitro”; χ2 test). (B) When the provirus was inserted inside a RefSeq gene, it was integrated more frequently in the same orientation as the host gene in UISs identified in vivo; in contrast, the orientation of UISs identified in vitro was random (vertical asterisks to the right of “vs in vitro”; χ2 test). Increasing UIS abundance was associated with an increased percentage of proviruses oriented in the same transcriptional sense as the host gene (asterisks below the ▵; χ2 test for trend). Sample size: In vitro, n = 2135; AC < 0.1, n = 4544; AC 0.1 to 1, n = 8649; AC 1 to 10, n = 727; HAM-TSP < 0.1, n = 26 200; HAM-TSP 0.1 to 1, n = 36 377; HAM-TSP 1 to 10, n = 2931; HAM-TSP > 10, n = 39; ATLL 0.1 to 1, n = 9827; ATLL 1 to 10, n = 1659; ATLL > 10, n = 69; ATLL Major UIS, n = 19. ***P < .001. **P < .01. *P < .05. NS indicates not significant (P > .05).

Similar articles

Cited by

References

    1. Proietti FA, Carneiro-Proietti AB, Catalan-Soares BC, Murphy EL. Global epidemiology of HTLV-I infection and associated diseases. Oncogene. 2005;24(39):6058–6068. - PubMed
    1. Kubota R, Fujiyoshi T, Izumo S, et al. Fluctuation of HTLV-I proviral DNA in peripheral blood mononuclear cells of HTLV-I-associated myelopathy. J Neuroimmunol. 1993;42(2):147–154. - PubMed
    1. Nagai M, Usuku K, Matsumoto W, et al. Analysis of HTLV-I proviral load in 202 HAM/TSP patients and 243 asymptomatic HTLV-I carriers: high proviral load strongly predisposes to HAM/TSP. J Neurovirol. 1998;4(6):586–593. - PubMed
    1. Etoh K, Yamaguchi K, Tokudome S, et al. Rapid quantification of HTLV-I provirus load: detection of monoclonal proliferation of HTLV-I-infected cells among blood donors. Int J Cancer. 1999;81(6):859–864. - PubMed
    1. Daenke S, Nightingale S, Cruickshank JK, Bangham CR. Sequence variants of human T-cell lymphotropic virus type I from patients with tropical spastic paraparesis and adult T-cell leukemia do not distinguish neurological from leukemic isolates. J Virol. 1990;64(3):1278–1282. - PMC - PubMed

Publication types

MeSH terms