Human blood CXCR5(+)CD4(+) T cells are counterparts of T follicular cells and contain specific subsets that differentially support antibody secretion
- PMID: 21215658
- PMCID: PMC3046815
- DOI: 10.1016/j.immuni.2010.12.012
Human blood CXCR5(+)CD4(+) T cells are counterparts of T follicular cells and contain specific subsets that differentially support antibody secretion
Erratum in
- Immunity. 2011 Jan 28;34(1):135
Abstract
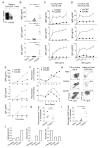
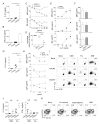
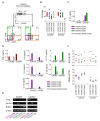
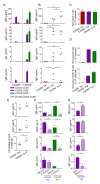
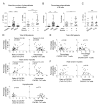
Although a fraction of human blood memory CD4(+) T cells expresses chemokine (C-X-C motif) receptor 5 (CXCR5), their relationship to T follicular helper (Tfh) cells is not well established. Here we show that human blood CXCR5(+)CD4(+) T cells share functional properties with Tfh cells and appear to represent their circulating memory compartment. Blood CXCR5(+)CD4(+) T cells comprised three subsets: T helper 1 (Th1), Th2, and Th17 cells. Th2 and Th17 cells within CXCR5(+), but not within CXCR5(-), compartment efficiently induced naive B cells to produce immunoglobulins via interleukin-21 (IL-21). In contrast, Th1 cells from both CXCR5(+) and CXCR5(-) compartments lacked the capacity to help B cells. Patients with juvenile dermatomyositis, a systemic autoimmune disease, displayed a profound skewing of blood CXCR5(+) Th cell subsets toward Th2 and Th17 cells. Importantly, the skewing of subsets correlated with disease activity and frequency of blood plasmablasts. Collectively, our study suggests that an altered balance of Tfh cell subsets contributes to human autoimmunity.
Copyright © 2011 Elsevier Inc. All rights reserved.
Figures

Comment in
-
Blood relatives of follicular helper T cells.Immunity. 2011 Jan 28;34(1):10-2. doi: 10.1016/j.immuni.2011.01.006. Immunity. 2011. PMID: 21272784
Similar articles
-
Decreased frequencies of circulating follicular helper T cell counterparts and plasmablasts in ankylosing spondylitis patients Naïve for TNF blockers.PLoS One. 2014 Sep 9;9(9):e107086. doi: 10.1371/journal.pone.0107086. eCollection 2014. PLoS One. 2014. PMID: 25203742 Free PMC article.
-
Constitutively altered frequencies of circulating follicullar helper T cell counterparts and their subsets in rheumatoid arthritis.Arthritis Res Ther. 2014 Dec 5;16(6):500. doi: 10.1186/s13075-014-0500-6. Arthritis Res Ther. 2014. PMID: 25475240 Free PMC article.
-
Blood CD4+CD45RO+CXCR5+ T cells are decreased but partially functional in signal transducer and activator of transcription 3 deficiency.J Allergy Clin Immunol. 2013 Apr;131(4):1146-56, 1156.e1-5. doi: 10.1016/j.jaci.2012.12.1519. Epub 2013 Feb 10. J Allergy Clin Immunol. 2013. PMID: 23403044
-
Follicular helper T cell in immunity and autoimmunity.Braz J Med Biol Res. 2016;49(5):e5209. doi: 10.1590/1414-431X20165209. Epub 2016 Apr 19. Braz J Med Biol Res. 2016. PMID: 27096200 Free PMC article. Review.
-
CD4(+) T-cell subsets in transplantation.Immunol Rev. 2013 Mar;252(1):183-91. doi: 10.1111/imr.12038. Immunol Rev. 2013. PMID: 23405905 Review.
Cited by
-
Targeting T Follicular Helper Cells to Control Humoral Allogeneic Immunity.Transplantation. 2021 Nov 1;105(11):e168-e180. doi: 10.1097/TP.0000000000003776. Transplantation. 2021. PMID: 33909968 Free PMC article. Review.
-
Human dendritic cell subsets in vaccination.Curr Opin Immunol. 2013 Jun;25(3):396-402. doi: 10.1016/j.coi.2013.05.001. Epub 2013 May 30. Curr Opin Immunol. 2013. PMID: 23725656 Free PMC article. Review.
-
Activation and Regulation of Indirect Alloresponses in Transplanted Patients With Donor Specific Antibodies and Chronic Rejection.Transpl Int. 2024 Aug 20;37:13196. doi: 10.3389/ti.2024.13196. eCollection 2024. Transpl Int. 2024. PMID: 39228658 Free PMC article. Review.
-
Helper T Cells in Idiopathic Membranous Nephropathy.Front Immunol. 2021 May 20;12:665629. doi: 10.3389/fimmu.2021.665629. eCollection 2021. Front Immunol. 2021. PMID: 34093559 Free PMC article. Review.
-
MiR-29a-3p negatively regulates circulating Tfh memory cells in patients with Graves' disease by targeting ICOS.Immunol Res. 2023 Apr;71(2):173-184. doi: 10.1007/s12026-022-09333-5. Epub 2022 Nov 2. Immunol Res. 2023. PMID: 36322282
References
-
- Acosta-Rodriguez EV, Rivino L, Geginat J, Jarrossay D, Gattorno M, Lanzavecchia A, Sallusto F, Napolitani G. Surface phenotype and antigenic specificity of human interleukin 17-producing T helper memory cells. Nature immunology. 2007;8:639–646. - PubMed
-
- Arce E, Jackson DG, Gill MA, Bennett LB, Banchereau J, Pascual V. Increased frequency of pre-germinal center b cells and plasma cell precursors in the blood of children with systemic lupus erythematosus. J Immunol. 2001;167:2361–2369. - PubMed
-
- Banchereau J, Bazan F, Blanchard D, Briere F, Galizzi JP, van Kooten C, Liu YJ, Rousset F, Saeland S. The CD40 antigen and its ligand. Annual review of immunology. 1994;12:881–922. - PubMed
Publication types
MeSH terms
Substances
Supplementary concepts
Grants and funding
- P01 CA084512-07S1/CA/NCI NIH HHS/United States
- U19 AI082715-01/AI/NIAID NIH HHS/United States
- R01 CA078846-07/CA/NCI NIH HHS/United States
- R01 CA078846-08/CA/NCI NIH HHS/United States
- R01 CA078846-01A1/CA/NCI NIH HHS/United States
- U19 AI057234/AI/NIAID NIH HHS/United States
- U19 AI057234-07/AI/NIAID NIH HHS/United States
- U19 AI082715/AI/NIAID NIH HHS/United States
- P01 CA084512-07/CA/NCI NIH HHS/United States
- U19 AI057234-04/AI/NIAID NIH HHS/United States
- P50 AR054083-04S1/AR/NIAMS NIH HHS/United States
- P50 AR054083-05/AR/NIAMS NIH HHS/United States
- U19 AI057234-02/AI/NIAID NIH HHS/United States
- U19 AI082715-02/AI/NIAID NIH HHS/United States
- R01 CA078846-04/CA/NCI NIH HHS/United States
- U19 AI057234-01/AI/NIAID NIH HHS/United States
- P01 CA084512-05A2/CA/NCI NIH HHS/United States
- R01 CA078846-05/CA/NCI NIH HHS/United States
- U19-AI057234/AI/NIAID NIH HHS/United States
- U19 AI057234-05/AI/NIAID NIH HHS/United States
- P01 CA084512-07S2/CA/NCI NIH HHS/United States
- P01 CA084512/CA/NCI NIH HHS/United States
- U19 AI057234-08/AI/NIAID NIH HHS/United States
- R01-CA078846/CA/NCI NIH HHS/United States
- R01 CA078846-10/CA/NCI NIH HHS/United States
- P50 AR054083-04/AR/NIAMS NIH HHS/United States
- P01 CA084512-06/CA/NCI NIH HHS/United States
- R01 CA078846-06/CA/NCI NIH HHS/United States
- U19 AI057234-06/AI/NIAID NIH HHS/United States
- R01 CA078846-09/CA/NCI NIH HHS/United States
- P50 AR054083-01/AR/NIAMS NIH HHS/United States
- U19 AI082715-03/AI/NIAID NIH HHS/United States
- R01-CA84512/CA/NCI NIH HHS/United States
- R01 CA078846-02/CA/NCI NIH HHS/United States
- P50 AR054083-03/AR/NIAMS NIH HHS/United States
- U19-AI082715-01/AI/NIAID NIH HHS/United States
- U19 AI057234-03/AI/NIAID NIH HHS/United States
- R01 CA078846-03/CA/NCI NIH HHS/United States
- R01 CA078846/CA/NCI NIH HHS/United States
- P01 CA084512-04/CA/NCI NIH HHS/United States
- P50 AR054083/AR/NIAMS NIH HHS/United States
- P50 AR054083-02/AR/NIAMS NIH HHS/United States
LinkOut - more resources
Full Text Sources
Other Literature Sources
Research Materials

