HIV-1 envelope subregion length variation during disease progression
- PMID: 21187897
- PMCID: PMC3002983
- DOI: 10.1371/journal.ppat.1001228
HIV-1 envelope subregion length variation during disease progression
Abstract
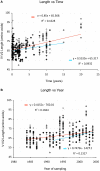
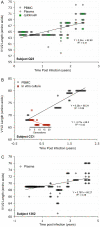
The V3 loop of the HIV-1 Env protein is the primary determinant of viral coreceptor usage, whereas the V1V2 loop region is thought to influence coreceptor binding and participate in shielding of neutralization-sensitive regions of the Env glycoprotein gp120 from antibody responses. The functional properties and antigenicity of V1V2 are influenced by changes in amino acid sequence, sequence length and patterns of N-linked glycosylation. However, how these polymorphisms relate to HIV pathogenesis is not fully understood. We examined 5185 HIV-1 gp120 nucleotide sequence fragments and clinical data from 154 individuals (152 were infected with HIV-1 Subtype B). Sequences were aligned, translated, manually edited and separated into V1V2, C2, V3, C3, V4, C4 and V5 subregions. V1-V5 and subregion lengths were calculated, and potential N-linked glycosylation sites (PNLGS) counted. Loop lengths and PNLGS were examined as a function of time since infection, CD4 count, viral load, and calendar year in cross-sectional and longitudinal analyses. V1V2 length and PNLGS increased significantly through chronic infection before declining in late-stage infection. In cross-sectional analyses, V1V2 length also increased by calendar year between 1984 and 2004 in subjects with early and mid-stage illness. Our observations suggest that there is little selection for loop length at the time of transmission; following infection, HIV-1 adapts to host immune responses through increased V1V2 length and/or addition of carbohydrate moieties at N-linked glycosylation sites. V1V2 shortening during early and late-stage infection may reflect ineffective host immunity. Transmission from donors with chronic illness may have caused the modest increase in V1V2 length observed during the course of the pandemic.
Conflict of interest statement
The authors have declared that no competing interests exist.
Figures


Similar articles
-
A Trimeric HIV-1 Envelope gp120 Immunogen Induces Potent and Broad Anti-V1V2 Loop Antibodies against HIV-1 in Rabbits and Rhesus Macaques.J Virol. 2018 Feb 12;92(5):e01796-17. doi: 10.1128/JVI.01796-17. Print 2018 Mar 1. J Virol. 2018. PMID: 29237847 Free PMC article.
-
Intrapatient alterations in the human immunodeficiency virus type 1 gp120 V1V2 and V3 regions differentially modulate coreceptor usage, virus inhibition by CC/CXC chemokines, soluble CD4, and the b12 and 2G12 monoclonal antibodies.J Virol. 2004 Jan;78(1):524-30. doi: 10.1128/jvi.78.1.524-530.2004. J Virol. 2004. PMID: 14671134 Free PMC article.
-
N-linked glycosylation of the V3 loop and the immunologically silent face of gp120 protects human immunodeficiency virus type 1 SF162 from neutralization by anti-gp120 and anti-gp41 antibodies.J Virol. 2004 Apr;78(7):3279-95. doi: 10.1128/jvi.78.7.3279-3295.2004. J Virol. 2004. PMID: 15016849 Free PMC article.
-
The HIV-1 gp120 V1V2 loop: structure, function and importance for vaccine development.Expert Rev Vaccines. 2014 Dec;13(12):1489-500. doi: 10.1586/14760584.2014.951335. Epub 2014 Aug 28. Expert Rev Vaccines. 2014. PMID: 25163695 Review.
-
HIV-1 subtype C predicted co-receptor tropism in Africa: an individual sequence level meta-analysis.AIDS Res Ther. 2020 Feb 7;17(1):5. doi: 10.1186/s12981-020-0263-x. AIDS Res Ther. 2020. PMID: 32033571 Free PMC article. Review.
Cited by
-
Features of Recently Transmitted HIV-1 Clade C Viruses that Impact Antibody Recognition: Implications for Active and Passive Immunization.PLoS Pathog. 2016 Jul 19;12(7):e1005742. doi: 10.1371/journal.ppat.1005742. eCollection 2016 Jul. PLoS Pathog. 2016. PMID: 27434311 Free PMC article.
-
Analysis of two cooperating antibodies unveils immune pressure imposed on HIV Env to elicit a V3-glycan supersite broadly neutralizing antibody lineage.Front Immunol. 2022 Sep 26;13:962939. doi: 10.3389/fimmu.2022.962939. eCollection 2022. Front Immunol. 2022. PMID: 36225920 Free PMC article.
-
HIV-1 diversity in the envelope glycoproteins: implications for viral entry inhibition.Viruses. 2013 Feb 6;5(2):595-604. doi: 10.3390/v5020595. Viruses. 2013. PMID: 23389465 Free PMC article. Review.
-
Characterization of HIV-1 envelopes in acutely and chronically infected injection drug users.Retrovirology. 2014 Nov 28;11:106. doi: 10.1186/s12977-014-0106-8. Retrovirology. 2014. PMID: 25430652 Free PMC article.
-
A Broadly Neutralizing Antibody Targets the Dynamic HIV Envelope Trimer Apex via a Long, Rigidified, and Anionic β-Hairpin Structure.Immunity. 2017 Apr 18;46(4):690-702. doi: 10.1016/j.immuni.2017.03.017. Immunity. 2017. PMID: 28423342 Free PMC article.
References
-
- Starcich BR, Hahn BH, Shaw GM, McNeely PD, Modrow S, et al. Identification and characterization of conserved and variable regions in the envelope gene of HTLV-III/LAV, the retrovirus of AIDS. Cell. 1986;45:637–648. - PubMed
-
- Cocchi F, DeVico AL, Garzino-Demo A, Cara A, Gallo RC, et al. The V3 domain of the HIV-1 gp120 envelope glycoprotein is critical for chemokine-mediated blockade of infection [see comments]. Nat Med. 1996;2:1244–1247. - PubMed
Publication types
MeSH terms
Substances
Grants and funding
- R01 AI045402/AI/NIAID NIH HHS/United States
- R01 AI055336/AI/NIAID NIH HHS/United States
- R01 AI047734/AI/NIAID NIH HHS/United States
- AI57005/AI/NIAID NIH HHS/United States
- R37 AI047734/AI/NIAID NIH HHS/United States
- R01 AI058894/AI/NIAID NIH HHS/United States
- AI45402/AI/NIAID NIH HHS/United States
- AI058894/AI/NIAID NIH HHS/United States
- AI27757/AI/NIAID NIH HHS/United States
- R01 AI049109/AI/NIAID NIH HHS/United States
- AI55336/AI/NIAID NIH HHS/United States
- AI52791/AI/NIAID NIH HHS/United States
- P01 AI057005/AI/NIAID NIH HHS/United States
- K08 AI052791/AI/NIAID NIH HHS/United States
- P30 AI027757/AI/NIAID NIH HHS/United States
- AI047734/AI/NIAID NIH HHS/United States
- AI49109/AI/NIAID NIH HHS/United States
LinkOut - more resources
Full Text Sources
Medical
Research Materials
Miscellaneous

