. 2011 Feb 25;286(8):6587-601.
doi: 10.1074/jbc.M110.210047. Epub 2010 Dec 13.

Artesunate activates mitochondrial apoptosis in breast cancer cells via iron-catalyzed lysosomal reactive oxygen species production

Affiliations

Artesunate activates mitochondrial apoptosis in breast cancer cells via iron-catalyzed lysosomal reactive oxygen species production

Anne Hamacher-Brady et al. J Biol Chem. .

Abstract

The antimalarial agent artesunate (ART) activates programmed cell death (PCD) in cancer cells in a manner dependent on the presence of iron and the generation of reactive oxygen species. In malaria parasites, ART cytotoxicity originates from interactions with heme-derived iron within the food vacuole. The analogous digestive compartment of mammalian cells, the lysosome, similarly contains high levels of redox-active iron and in response to specific stimuli can initiate mitochondrial apoptosis. We thus investigated the role of lysosomes in ART-induced PCD and determined that in MCF-7 breast cancer cells ART activates lysosome-dependent mitochondrial outer membrane permeabilization. ART impacted endolysosomal and autophagosomal compartments, inhibiting autophagosome turnover and causing perinuclear clustering of autophagosomes, early and late endosomes, and lysosomes. Lysosomal iron chelation blocked all measured parameters of ART-induced PCD, whereas lysosomal iron loading enhanced death, thus identifying lysosomal iron as the lethal source of reactive oxygen species upstream of mitochondrial outer membrane permeabilization. Moreover, lysosomal inhibitors chloroquine and bafilomycin A1 reduced ART-activated PCD, evidencing a requirement for lysosomal function during PCD signaling. ART killing did not involve activation of the BH3-only protein, Bid, yet ART enhanced TNF-mediated Bid cleavage. We additionally demonstrated the lysosomal PCD pathway in T47D and MDA-MB-231 breast cancer cells. Importantly, non-tumorigenic MCF-10A cells resisted ART-induced PCD. Together, our data suggest that ART triggers PCD via engagement of distinct, interconnected PCD pathways, with hierarchical signaling from lysosomes to mitochondria, suggesting a potential clinical use of ART for targeting lysosomes in cancer treatment.


Figures
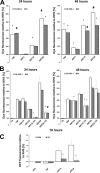
FIGURE 1.
FIGURE 1.
ART activates ROS-dependent cell death in MCF-7 cells. A, ART-induced cell death is dose- and time-dependent. MCF-7 cells were either incubated in KHS alone or treated with 1, 10, or 20 μg/ml ART in KHS. Cell death was assessed at 24 and 48 h using exclusion dyes PI (1 μg/ml) and YO-PRO-1 (0.1 μm) in a fluorescence plate reader assay. Cell death is represented as the percentage of dye fluorescence normalized to KHS, and the x axis crosses at 100%, i.e. basal KHS levels (*, p < 0.05; #, p < 0.001, compared with KHS). B, ART-induced PCD is inhibited by the ROS scavenger TX. MCF-7 cells were treated with the indicated drugs in KHS for 24 and 48 h as indicated, and cell death was determined as described in A. (*, p < 0.05; #, p < 0.001, without TX versus with TX). C, TX blocks ART-induced increase in ROS. MCF-7 cells were subjected to drug treatments with and without TX (0.25 mm). At 18 h ROS production was assessed using H2DCF-DA and graphed normalized to KHS. (*, p < 0.05, without TX versus with TX).
FIGURE 2.
FIGURE 2.
Endolysosomal iron mediates ART-activated PCD signaling. A and B, MCF-7 cells were treated with the iron chelator DFO (0.1 mm) and/or the indicated drug in KHS. A, ROS generation was determined at 18 h using H2DCF-DA (10 μm) (*, p < 0.05; without DFO versus with DFO). B, cell death was measured at 48 h using YO-PRO-1 (1 μm) and PI (1 μg/ml) (*, p < 0.05; #, p < 0.001, without DFO versus with DFO). The percentage of dye fluorescence normalized to KHS is graphed. The x axis crosses at 100% (i.e. KHS), signifying basal ROS (A) or cell death (B) levels. C, endolysosomal iron content was increased via incubation with diferric HTF (0.05, 0.5, and 5 μm). Cell death was measured at 24 and 48 h using PI (1 μg/ml). Graphs indicate responses as the percentage of dye fluorescence normalized to KHS, and the x axis crosses at 100%, i.e. basal KHS levels (*, p < 0.05, with HTF versus without HTF).
FIGURE 3.
FIGURE 3.
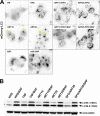
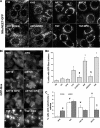
ART inhibits turnover of AVs and induces perinuclear AV clustering. A, MCF-7 cells stably expressing mCherry-LC3 were subjected to the indicated conditions for 24 h. Autophagic flux was inferred by comparing cellular AV content and localization in the absence (steady-state AVs) and presence (cumulative AVs) of lysosomal inhibitor BAF (100 nm, 3 h of treatment). B, Western blot analysis of cytosolic LC3B-I (∼18 kDa) and membrane-bound LC3B-II (∼16 kDa) abundance in the absence and presence of BAF.
FIGURE 4.
FIGURE 4.
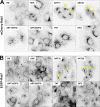
ART induces perinuclear clustering of early endosomes, late endosomes, and lysosomes. A, at 24 h of indicated drug treatments, abundance and intracellular distribution of early endosomes were investigated in MCF-7 cells stably expressing mCherry-Rab5. B, abundance and intracellular distribution of late endosomes and lysosomes were investigated in MCF-7 cells stably expressing GFP-Rab7 at 24 h of indicated drug treatments.
FIGURE 5.
FIGURE 5.
ART disrupts localization of endolysosomes but not apparent function of critical lysosomal parameters. A, wild-type MCF-7 cells were subjected to the indicated experimental conditions for 24 h and then labeled with the lysosomal pH indicator LTR (5 nm) and analyzed by fluorescence microscopy. B, MCF-7 cells stably expressing GFP-Rab7 were incubated with MR cathepsin B substrate (2.2 μm) following 24 h of drug treatments. Both GFP-Rab7 and MR were analyzed by fluorescence microscopy. C, Rab7, LTR, and MR staining and intensity patterns were analyzed in MCF-7 wild-type cells (LTR) and cells stably expressing GFP-Rab7 (Rab7 and MR) following 3 h of treatment. D, flow cytometry was used to quantify population level responses. The mean fluorescence intensity of lysosomal LTR (0.1 μm) and MR (2.2 μm) was determined. Graphs indicate responses as the percentage of dye fluorescence normalized to KHS, and the x axis crosses at 100% (*, p < 0.05; #, p < 0.001, compared with KHS).
FIGURE 6.
FIGURE 6.
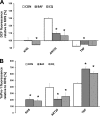
ART-induced PCD is dependent on lysosomal function. Co-treatments with lysosomal perturbators BAF (0.1 μm) and CQ (30 μm) and either ART or TNF were performed in wild-type MCF-7 cells A, ROS generation was determined at 18 h using H2DCF- DA (10 μm). B, cell death was measured at 18 h using YO-PRO-1 (0.1 μm) Graphs indicate responses as the percentage of dye fluorescence normalized to KHS, and the x axis crosses at 100%, i.e. basal KHS levels (*, p < 0.05; #, p < 0.001, without versus with co-treatments).
FIGURE 7.
FIGURE 7.
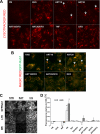
ART activates mitochondrial apoptosis that is dependent on lysosomal iron. A, the impact of ART on mitochondrial morphology was investigated in MCF-7 cells stably expressing the outer mitochondrial membrane GFP marker at 24 h of drug treatment. B, MCF-7 cells stably expressing GFP-Bax were incubated in either KHS alone or in combination with the indicated drugs for 24 h. Bi, shown are representative maximum Z-projections. Bii, quantification was performed by classifying GFP-Bax cells as displaying either diffuse cytosolic or clustered mitochondrial GFP-Bax. Represented is the percentage of cells with punctate GFP-Bax distribution (*, p < 0.05, compared with KHS; $, p < 0.05, without DFO versus with DFO). C, cytochrome c release was quantified in wild-type MCF-7 cells by classifying mitochondrial cytochrome c, i.e. colocalized cytochrome c and COX IV, or released cytochrome c, i.e. little or no colocalization of cytochrome c with COX IV. Represented is the percentage of cells with released cytochrome c per total cells scored (*, p < 0.05; #, p < 0.001, compared with KHS; $, p < 0.05, without DFO versus with DFO).
FIGURE 8.
FIGURE 8.
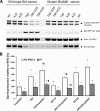
ART alone does not cause Bid cleavage but can amplify TNF-induced Bid cleavage. A, Western blot detection of Bid activity in response to ART is shown. Stable cell lines expressing either a wild-type Bid sensor (mCherry-Bid-GFP) or a caspase 8-insensitive BidΔ60 sensor were treated with TNF, ART, or combined TNF/ART. tBid-GFP was detected using antibody against GFP. Endogenous Bid was detected using antibody against Bid. B, wild-type MCF-7 cells were subjected to 48 h of treatment with or without cathepsin inhibitors PepA (5 μg/ml) and EST (10 μg/ml). Graphs indicate responses as the percentage of dye fluorescence normalized to KHS, and the x axis crosses at 100%, i.e. basal KHS levels (*, p < 0.05, compared with KHS control; $, p < 0.05, with PepA/EST versus without PepA/EST).
FIGURE 9.
FIGURE 9.
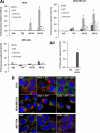
T47D and MDA-MB-231 but not MCF-10A cells undergo lysosomal PCD upon ART treatment. Ai, T47D, MDA-MB-231, and MCF-10A cells were treated for 48 h with 10 or 20 μg/ml ART in KHS in combination with the indicated co-treatments. The KHS data set contains single treatments with TX, DFO, or HTF. In ART10 and ART20 data sets, TX and DFO were added in co-treatment with HTF, as ART10 and ART20 alone had a minor effect on cell death. Cell death was measured using PI staining. Represented is the percentage of dye fluorescence normalized to KHS, and the x axis crosses at 100% (basal KHS levels) (*, p < 0.05; #, p < 0.001, compared with KHS control; &, p < 0.05; $, p < 0.001, ART + HTF without versus with co-treatment with DFO or TX. Aii, as a positive control for death induction, MCF-10A cells were treated with KHS with and without TNF in combination with 10 μm MG132 for 24 h. Cell death was determined as in Ai (*, p < 0.05, compared with KHS). B, T47D, MDA-MB-231, and MCF-10A cells were treated with the indicated drug combinations. At 24 h cells were fixed and immunostained for COX IV and Lamp2a to assess the intracellular localization of mitochondria (green) and lysosomes (red), respectively. Nuclei were stained with Hoechst 33342 (blue).

Similar articles

Cited by

References

    1. Klayman D. L. (1985) Science 228, 1049–1055 - PubMed
    1. Efferth T., Volm M. (2005) In Vivo 19, 225–232 - PubMed
    1. Lai H., Sasaki T., Singh N. P., Messay A. (2005) Life Sci. 76, 1267–1279 - PubMed
    1. Efferth T. (2006) Curr. Drug Targets 7, 407–421 - PubMed
    1. Chen H., Sun B., Pan S., Jiang H., Sun X. (2009) Anticancer Drugs 20, 131–140 - PubMed

Publication types