. 2011 Jan;85(2):996-1010.
doi: 10.1128/JVI.01528-10. Epub 2010 Nov 10.

Quantitative studies of Epstein-Barr virus-encoded microRNAs provide novel insights into their regulation

Affiliations

Quantitative studies of Epstein-Barr virus-encoded microRNAs provide novel insights into their regulation

Richard Amoroso et al. J Virol. 2011 Jan.

Abstract

Epstein-Barr virus (EBV) has been shown to encode at least 40 microRNAs (miRNAs), an important class of molecules that negatively regulate the expression of many genes through posttranscriptional mechanisms. Here, we have used real-time PCR assays to quantify the levels of EBV-encoded BHRF1 and BART miRNAs in latently infected cells and in cells induced into the lytic cycle. During latency, BHRF1 miRNAs were seen only in cells with detectable Cp- and/or Wp-initiated EBNA transcripts, while the BART miRNAs were expressed in all forms of latent infection. Surprisingly, levels of different BART miRNAs were found to vary up to 50-fold within a cell line. However, this variation could not be explained by differential miRNA turnover, as all EBV miRNAs appeared to be remarkably stable. Following entry into the virus lytic cycle, miR-BHRF1-2 and -1-3 were rapidly induced, coincident with the onset of lytic BHRF1 transcripts, while miR-BHRF1-1 expression was delayed until 48 h and correlated with the appearance of Cp/Wp-initiated EBNA transcripts. In contrast, levels of BART miRNAs were relatively unchanged during virus replication, despite dramatic increases in BART transcription. Finally, we show that BHRF1 and BART miRNAs were delayed relative to the induction of BHRF1 and BART transcripts in freshly infected primary B cell cultures. In summary, our data show that changes in BHRF1 and BART transcription are not necessarily reflected in altered miRNA levels, suggesting that miRNA maturation is a key step in regulating steady-state levels of EBV miRNAs.


Figures

FIG. 1.
FIG. 1.
Schematic organization of the EBV genome and location of EBV miRNAs. (A) Three different forms of virus latent gene expression in BL cell lines and LCLs. The location of viral promoters and splice structures of viral transcripts are shown relative to a linear representation of the EBV genome. Conventional latency I BLs express a single latent antigen EBNA1 transcribed from a viral promoter in the BamHI Q region (Qp). Wp-restricted BL lines are characterized by the presence of an EBNA2-deleted EBV genome; these BLs express EBNA1, -3A, -3B, -3C, and -LP, along with BHRF1, all transcribed from the latency III BamHI W promoter (Wp), but in the absence of EBNA2 and the latent membrane proteins (LMPs). Growth-transformed LCLs express all six EBNAs and BHRF1, predominantly from transcripts initiated at the BamHI C promoter (Cp), along with the LMPs which are transcribed from separate promoters in the BamHI N region. EBERs (not shown) and BamHI A rightward transcripts (BARTs) are present in all three forms of latency. Also shown are the positions of the BHRF1 and BART miRNAs, the latent origin of replication (oriP), and the terminal repeat region (TR). (B) Detailed structure of BHRF1 transcripts and location of BHRF1-derived miRNAs. All three BHRF1 miRNAs may be generated either by processing of an intron present within the Cp/Wp-initiated primary EBNA transcript or by processing of the 5′ and 3′ untranslated regions within latent BHRF1 transcripts with the W2-Y1-Y2-BHRF1 structure. In contrast, lytic BHRF1 transcripts initiated from the alternative BHRF1p promoter encode only miR-BHRF1-2 and miR-BHRF1-3. (C) Detailed structure of the highly spliced BARTs and location of the BART-derived miRNAs (adapted from Edwards et al. [21]). The BART miRNAs form two clusters within the BART introns, with the exception of mirBART2, which lies further downstream. The prototype B95-8 EBV strain carries a 12-kb deletion in this region which removes several cluster 1 miRNAs and all cluster 2 miRNAs (shown in italics).
FIG. 2.
FIG. 2.
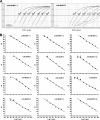
Sensitivity of QPCR assays for detecting EBV miRNAs. (A) cDNA samples containing known numbers of synthetic miRNAs (108 to 102 copies) were used to test the absolute sensitivity of each QPCR assay. Shown are representative PCR amplification plots for miR-BHRF1-1 and miR-BART3. (B) Standard curves obtained for all 12 miRNAs obtained by plotting the cycle threshold (CT) values against log input RNA copy number. Open circles indicate absence of a detectable signal (CT = 40).
FIG. 3.
FIG. 3.
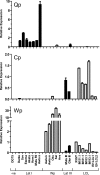
Expression of latent transcripts in EBV-positive B cell lines. Latency I-associated Qp transcripts and latency III-associated Cp- and Wp-initiated transcripts were quantified by QPCR in seven latency I BLs (Dante, Sav, Ezema, Akata, Kem, and Awia cl. a), five Wp-restricted BLs (Awia cl. k and m, Oku, Sal, and Ava), two latency III BLs (Mutu III and Glor III), and seven LCLs (X50-7, IM51, -81, -83, -93, EH LCL1, and EH LCL2); DG75 was included as a negative control. Data were normalized to cellular PGK levels and expressed relative to a suitable positive reference line, which was assigned an arbitrary value of 1. Error bars indicate standard deviations for replicate assays.
FIG. 4.
FIG. 4.
Expression of BHRF1 transcripts and BHRF1 miRNAs in EBV-positive B cell lines. (A) Total BHRF1 transcripts, Cp/Wp-initiated latent BHRF1 transcripts, and immediate-early BZLF1 transcripts were quantified by QPCR with the same cell lines as those shown in Fig. 3. BHRF1 values are expressed relative to the level for a reference LCL, while BZLF1 values are expressed relative to the level for a spontaneous LCL and adjusted so that a value of 1 is equivalent to 100% positive cells. (B) Expression of BHRF1 miRNAs in the same cell lines determined by QPCR. Data were normalized to RNU48 expression and expressed as absolute copy numbers per pg total RNA. Error bars indicate standard deviations for replicate assays. Note that Sal-BL is deleted for miR-BHRF1-1, as indicated by the dagger symbol.
FIG. 5.
FIG. 5.
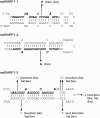
Sequence variation in BHRF1 miRNAs. Shown is a summary of sequence changes seen in Sav-BL, Akata-BL, Kem-BL, Mutu-BL, Awia-BL, Oku-BL, Sal-BL, Ava-BL, Glor-BL, X50-7 LCL, and IM51 LCL. In each case, the prototype B95-8 sequence of the pre-miRNA is shown with the mature miRNA indicated in bold italicized text. Sequence changes are marked by the arrows, with the cell line indicated in brackets. Using Mfold to calculate the minimum free energy (ΔG) of the folded pre-miRNA, the C-to-U change in mir-BHRF1-1 is predicted to increase ΔG from −25.5 to −22.5 kcal/mol. The G-to-A substitution seen in miR-BHRF1-2 markedly increases ΔG from −27.1 to −20.5 kcal/mol. In the case of miR-BHRF1-3, the six nucleotide changes marginally decrease ΔG from −23.2 to −24.3 kcal/mol.
FIG. 6.
FIG. 6.
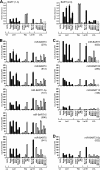
Expression of BART transcripts and mirBART miRNAs in EBV-positive B cell lines. (A) BART transcripts were quantified by QPCR using assays specific for either the exon 1-3 or the exon 2-3 splice variants in the same cell lines as those shown in Fig. 3. Data were normalized to PGK expression, and results are expressed relative to those for the EBV-positive epithelial tumor cell line C666-1. Panels B and C show expression of cluster 1 and cluster 2 BART miRNAs, respectively. Data were normalized to RNU48 expression and are expressed as copy numbers per pg input RNA. Error bars indicate standard deviations for replicate assays. Data points highlighted with daggers correspond to cell lines carrying a BART deletion. For comparison, copy numbers of BART miRNAs per pg C666-1 RNA are shown in parentheses in each histogram.
FIG. 7.
FIG. 7.
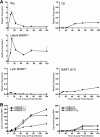
Stability of EBV transcripts and miRNAs. (A) X50/7 cells were treated with 5 μg/ml actinomycin D, harvested at the indicated time points, and then analyzed for EBV transcripts and miRNAs. The left hand panel shows the residual expression of c-myc RNA, latent BHRF1 transcripts, and BHRF1 miRNAs, while the right hand panel shows the expression of BART (1-3) transcripts and selected BART miRNAs. (B) Summary of data from Sal-BL, Ava-BL, and X50/7. The histograms indicate the expression of the indicated transcripts and miRNAs measured at 12 h after the addition of actinomycin D. All data were normalized to RNA input.
FIG. 8.
FIG. 8.
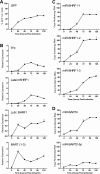
Expression of EBV transcripts and miRNAs in lytic AKBM cultures at 24 h postinduction. (A) BZLF1-positive AKBM cells were enumerated at the indicated time points postinduction by staining with BZ.1 anti-BZLF1 antibody and then analyzed by flow cytometry. (B) BHRF1 transcripts and BARTs quantified by QPCR at the indicated time points. Latent BHRF1 values are expressed relative to the level for a reference LCL, while lytic BHRF1 and BZLF1 values are expressed such that a value of 1 is equivalent to 100% positive cells. (C) Expression of selected BHRF1 miRNAs and BART miRNAs determined by QPCR at the indicated time points. Data were normalized to RNU48 expression and are expressed as copy numbers per pg input RNA. Error bars indicate standard deviations for replicate assays.
FIG. 9.
FIG. 9.
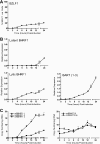
Extended time course showing expression of EBV transcripts and miRNAs in lytic AKBM cultures. (A) Lytic GFP-positive AKBM cells were enumerated at the indicated time points postinduction by flow cytometry. (B) Wp, latent BHRF1 and lytic BHRF1 transcripts, and BARTs (exon 1-3 splice form) were quantified by QPCR. Panels C and D show expression of selected BHRF1 and BART miRNAs, respectively, determined by QPCR. Error bars indicate standard deviations for replicate assays.
FIG. 10.
FIG. 10.
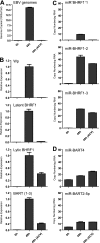
Effect of ACV on expression of EBV transcripts and miRNAs in induced AKBM cultures. (A) EBV genome load quantified by QPCR at 48 h postinduction. Data were normalized to cellular beta-2-microblobulin copy numbers and are expressed as numbers of EBV genomes per cell. (B) Wp, latent and lytic BHRF1 transcripts and BARTs (exon 1-3 splice) quantified by QPCR at 48 h postinduction. Data are expressed relative to values seen in the uninhibited culture. Panels C and D show expression of selected BHRF1 and BART miRNAs, respectively, determined by QPCR. Data were normalized to RNU48 expression and are expressed as copy numbers per pg input RNA. Error bars indicate standard deviations for replicate assays.
FIG. 11.
FIG. 11.
Expression of latent transcripts and EBV miRNAs in primary B cells infected with EBV in vitro. (A) Wp- and Cp-initiated transcripts, BHRF1 transcripts, and BARTs were quantified by QPCR at the indicated time points postinfection. Since the recombinant EBV used in these experiments carries the same BamHI A deletion as the B95-8 strain, BARTs were detected using a primer-probe combination which amplified across the exon 6-7 splice junction. (B) Expression of selected BHRF1 and BART miRNAs measured by QPCR. Data were normalized to RNU48 expression and are expressed as copy numbers per pg input RNA. Error bars indicate standard deviations for replicate assays.

Similar articles

Cited by

References

    1. Alfieri, C., M. Birkenbach, and E. Kieff. 1991. Early events in Epstein-Barr virus infection of human B lymphocytes. Virology 181:595-608. - PubMed
    1. Allday, M. J., D. H. Crawford, and B. E. Griffin. 1989. Epstein-Barr virus latent gene expression during the initiation of B cell immortalization. J. Gen. Virol. 70:1755-1764. - PubMed
    1. Al-Mozaini, M., et al. 2009. Epstein-Barr virus BART gene expression. J. Gen. Virol. 90:307-316. - PubMed
    1. Altmann, M., and W. Hammerschmidt. 2005. Epstein-Barr Virus provides a new paradigm: a requirement for the immediate inhibition of apoptosis. PLoS Biol. 3:e404. - PMC - PubMed
    1. Anderton, E., J. Yee, P. Smith, T. Crook, R. E. White, and M. J. Allday. 2008. Two Epstein-Barr virus (EBV) oncoproteins cooperate to repress expression of the proapoptotic tumour-suppressor Bim: clues to the pathogenesis of Burkitt's lymphoma. Oncogene 27:421-433. - PubMed

Publication types

LinkOut - more resources