

Serum autoantibody profiling using a natural glycoprotein microarray for the prognosis of early melanoma
- PMID: 20879797
- PMCID: PMC2974814
- DOI: 10.1021/pr100856k
Serum autoantibody profiling using a natural glycoprotein microarray for the prognosis of early melanoma
Abstract
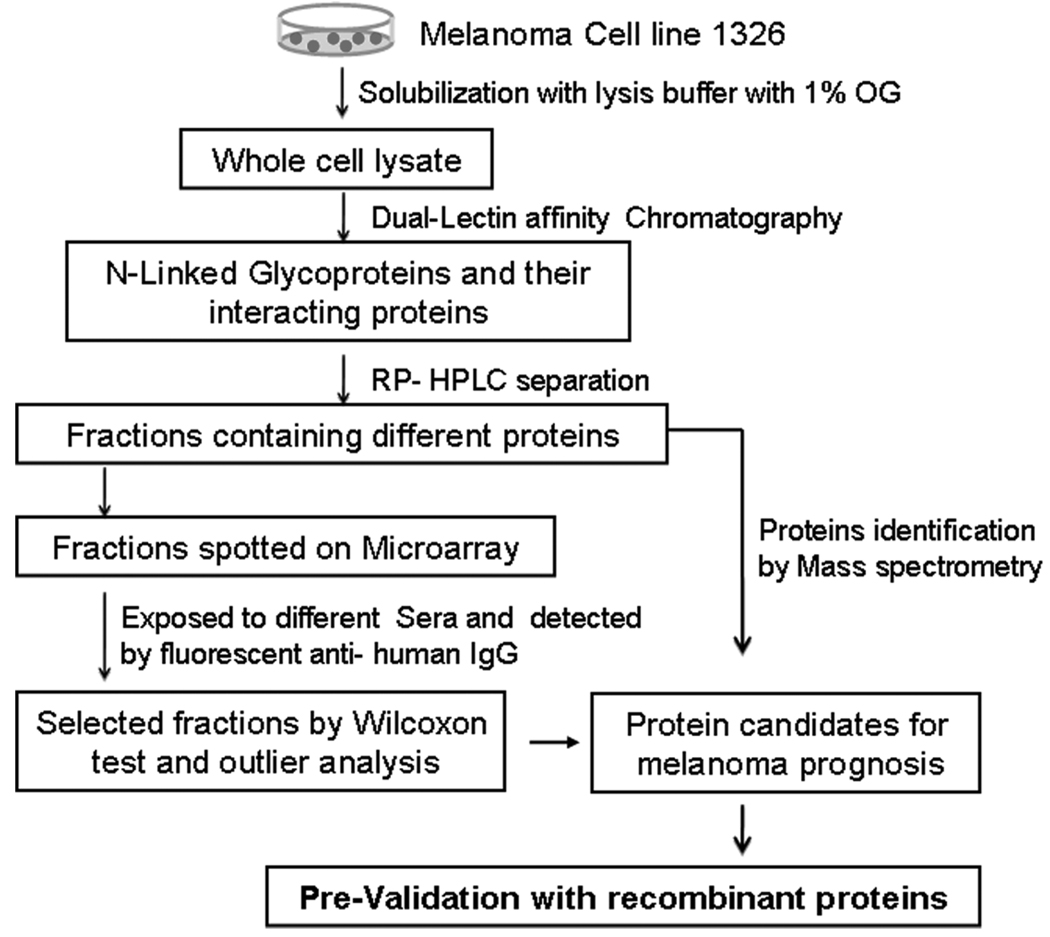
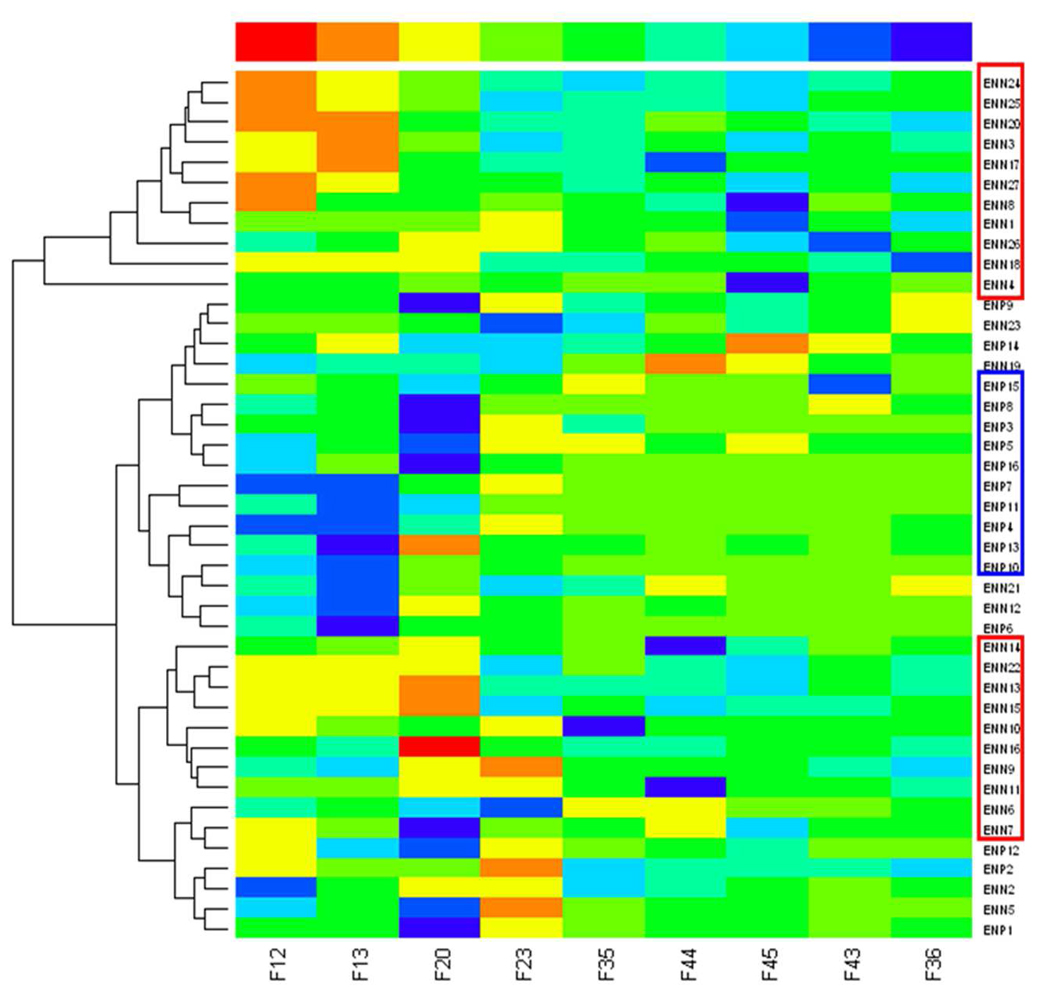
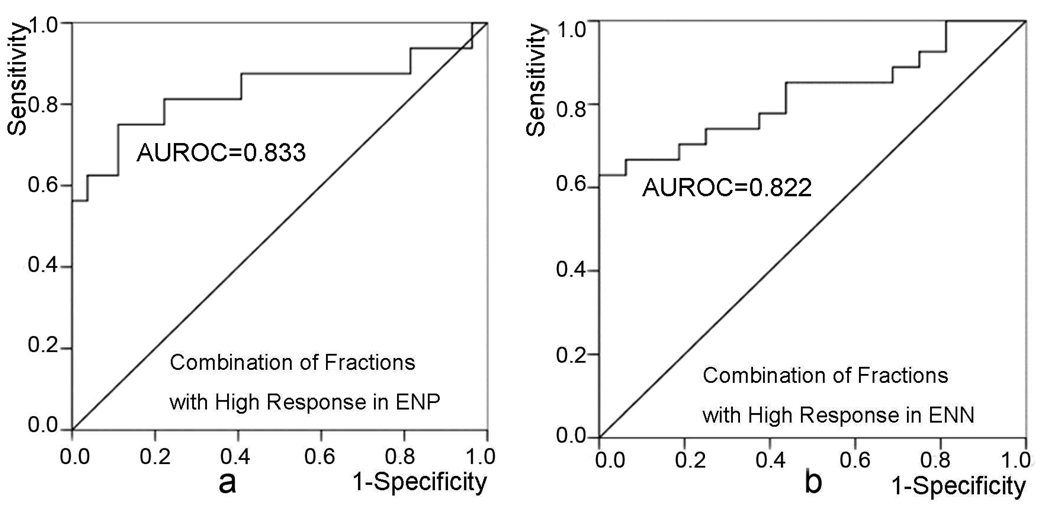
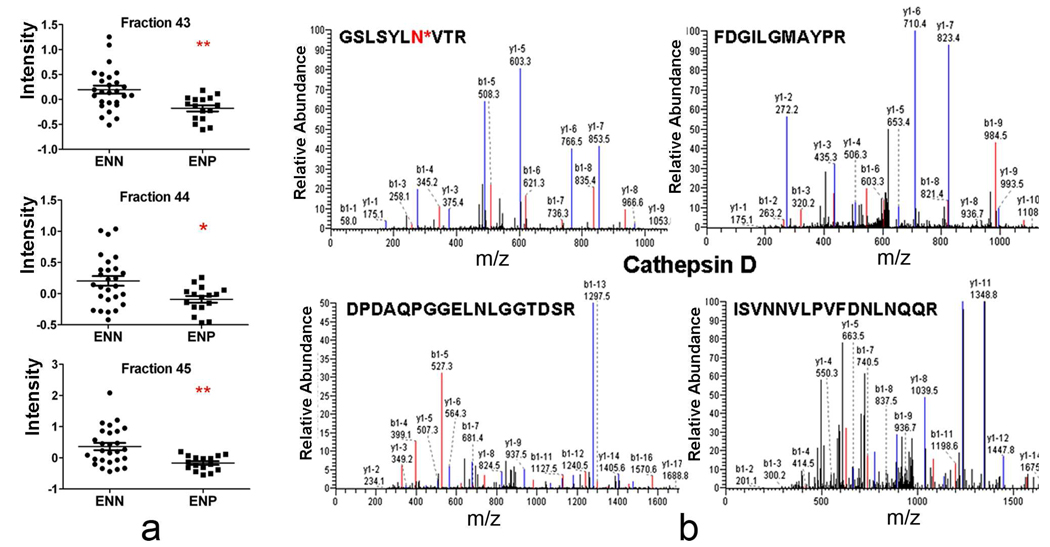
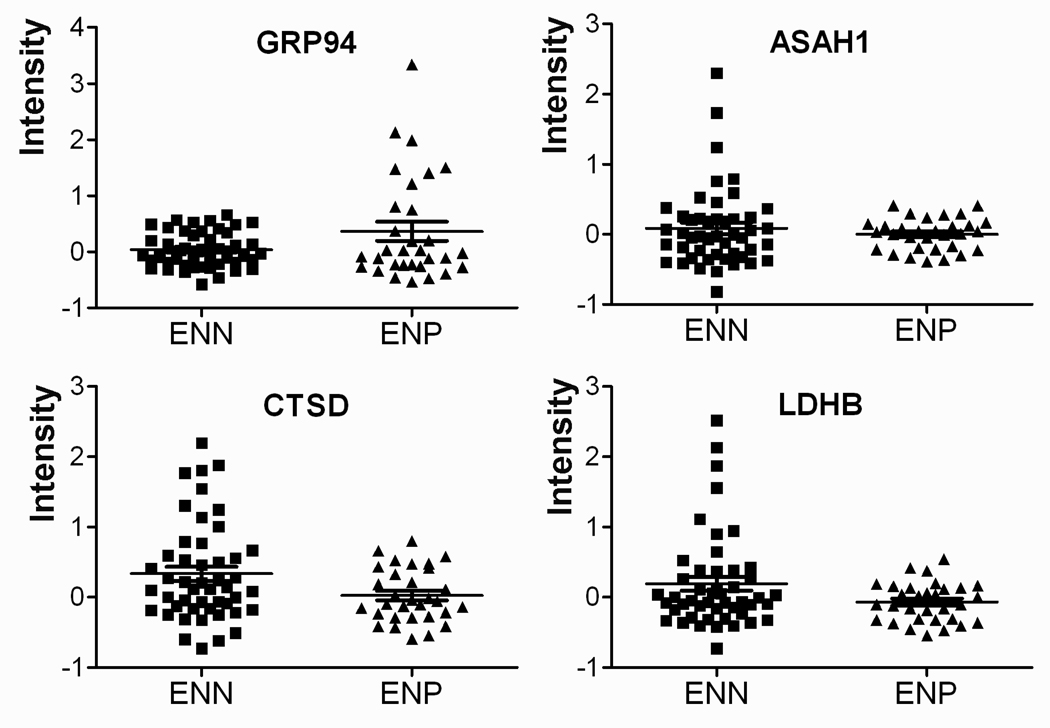
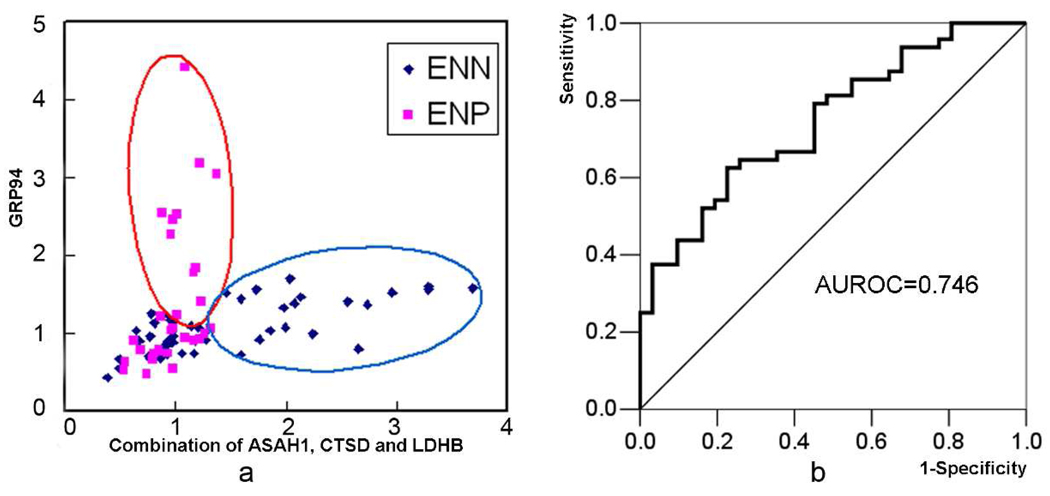
The poor prognosis of melanoma and the high cost of lymph node biopsy for melanoma patients have led to an urgent need for the discovery of convenient and accurate prognostic indicators. Here, we have developed a natural glycoprotein microarray to discover serum autoantibodies to distinguish between patients with node negative melanoma and node positive melanoma. Dual-lectin affinity chromatography was used to extract glycoproteins from a melanoma cell line. Liquid-based reverse phase separation and microarray platforms were then applied to separate and spot these natural proteins on nitrocellulose slides. The serum autoantibodies were investigated by exposing these proteins to sera from 43 patients that have already been diagnosed to have different stages of early melanoma. The combination of 9 fractions provides a 55% sensitivity with 100% specificity for the detection of node positive against node negative and a 62% sensitivity with 100% specificity for the detection of node negative against node positive. Recombinant proteins were used to confirm the results using a sample set with 79 patients with diagnosed melanoma. The response of sera against recombinant 94 kD glucose-regulated protein (GRP94), acid ceramidase (ASAH1), cathepsin D (CTSD), and lactate dehydrogenase B (LDHB) shared a similar pattern to the fractions where they were identified. The glycoarray platform provides a convenient and highly reproducible method to profile autoantibodies that could be used as serum biomarkers for prognosis of melanoma.
Figures
Similar articles
-
Clinical utility of serum autoantibodies detected by protein microarray in melanoma.Int J Proteomics. 2011;2011:413742. doi: 10.1155/2011/413742. Epub 2011 Oct 19. Int J Proteomics. 2011. PMID: 22084687 Free PMC article.
-
Tumor-associated autoantibody signature for the early detection of gastric cancer.Int J Cancer. 2013 Jan 1;132(1):137-47. doi: 10.1002/ijc.27667. Epub 2012 Jul 3. Int J Cancer. 2013. PMID: 22684876
-
Human Blood Autoantibodies in the Detection of Colorectal Cancer.PLoS One. 2016 Jul 6;11(7):e0156971. doi: 10.1371/journal.pone.0156971. eCollection 2016. PLoS One. 2016. PMID: 27383396 Free PMC article.
-
Serum autoantibodies as biomarkers for early cancer detection.FEBS J. 2009 Dec;276(23):6880-904. doi: 10.1111/j.1742-4658.2009.07396.x. Epub 2009 Oct 26. FEBS J. 2009. PMID: 19860826 Review.
-
A systematic review of serum autoantibodies as biomarkers for pancreatic cancer detection.Oncotarget. 2016 Mar 8;7(10):11151-64. doi: 10.18632/oncotarget.7098. Oncotarget. 2016. PMID: 26840568 Free PMC article. Review.
Cited by
-
Dendritic cell-based vaccination in metastatic melanoma patients: phase II clinical trial.Oncol Rep. 2012 Oct;28(4):1131-8. doi: 10.3892/or.2012.1956. Epub 2012 Aug 7. Oncol Rep. 2012. PMID: 22895835 Free PMC article. Clinical Trial.
-
Outlier-Based Differential Expression Analysis in Proteomics Studies.J Proteomics Bioinform. 2011 Jun 18;4(6):116-122. doi: 10.4172/jpb.1000177. J Proteomics Bioinform. 2011. PMID: 21949600 Free PMC article.
-
Autoantibody signature in hepatocellular carcinoma using seromics.J Hematol Oncol. 2020 Jul 2;13(1):85. doi: 10.1186/s13045-020-00918-x. J Hematol Oncol. 2020. PMID: 32616055 Free PMC article.
-
Fragment-Based Hologram QSAR Studies on a Series of 2,4-Dioxopyrimidine-1-Carboxamides As Highly Potent Inhibitors of Acid Ceramidase.Iran J Pharm Res. 2016 Winter;15(Suppl):139-148. Iran J Pharm Res. 2016. PMID: 28058055 Free PMC article.
-
Discovery of highly potent acid ceramidase inhibitors with in vitro tumor chemosensitizing activity.Sci Rep. 2013;3:1035. doi: 10.1038/srep01035. Epub 2013 Jan 8. Sci Rep. 2013. PMID: 23301156 Free PMC article.
References
-
- Jerant AF, Johnson JT, Sheridan CD, Caffrey TJ. Early detection and treatment of skin cancer. Am Fam Physician. 2000;62(2):357–368. 375-356, 381-352. - PubMed
-
- Jemal A, Seigel R, Ward E, Hao Y, Xu J, Thun MJ. Cancer Statistics, 2009. CA Cancer J Clin. 2009;59:225–249. - PubMed
-
- Morton DL, Thompson JF, Cochran AJ, Mozzillo N, Elshoff R, Essner R, Nieweg OE, Roses DF, Hoekstra HJ. Sentinel-node biopsy or nodal observation in melanoma. NEJM. 2006;355(13):1307–1317. - PubMed
-
- Blazer DG, Sondak VK, Sabel MS. Surgical therapy of cutaneous melanoma. Seminars in Oncology. 2007;34:270–280. - PubMed
-
- Ulevitch RJ. Therapeutics targeting the innate immune system. Nat Rev Immunol. 2004;4(7):512–520. - PubMed
Publication types
MeSH terms
Substances
Grants and funding
LinkOut - more resources
Full Text Sources
Other Literature Sources
Medical
Miscellaneous
