Virally induced cellular microRNA miR-155 plays a key role in B-cell immortalization by Epstein-Barr virus
- PMID: 20844043
- PMCID: PMC2977875
- DOI: 10.1128/JVI.01248-10
Virally induced cellular microRNA miR-155 plays a key role in B-cell immortalization by Epstein-Barr virus
Abstract
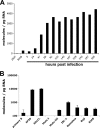
Infection of resting primary human B cells by Epstein-Barr virus (EBV) results in their transformation into indefinitely proliferating lymphoblastoid cell lines (LCLs). LCL formation serves as a model for lymphomagenesis, and LCLs are phenotypically similar to EBV-positive diffuse large B-cell lymphomas (DLBCLs), which represent a common AIDS-associated malignancy. B-cell infection by EBV induces the expression of several cellular microRNAs (miRNAs), most notably miR-155, which is overexpressed in many tumors and can induce B-cell lymphomas when overexpressed in animals. Here, we demonstrate that miR-155 is the most highly expressed miRNA in LCLs and that the selective inhibition of miR-155 function specifically inhibits the growth of both LCLs and the DLBCL cell line IBL-1. Cells lacking miR-155 are inefficient in progressing through S phase and spontaneously undergo apoptosis. In contrast, three other B-cell lymphoma lines, including two EBV-positive Burkitt's lymphoma cell lines, grew normally in the absence of miR-155 function. These data identify the induction of cellular miR-155 expression by EBV as critical for the growth of both laboratory-generated LCLs and naturally occurring DLBCLs and suggest that targeted inhibition of miR-155 function could represent a novel approach to the treatment of DLBCL in vivo.
Figures


Similar articles
-
The Epstein-Barr virus (EBV)-induced tumor suppressor microRNA MiR-34a is growth promoting in EBV-infected B cells.J Virol. 2012 Jun;86(12):6889-98. doi: 10.1128/JVI.07056-11. Epub 2012 Apr 11. J Virol. 2012. PMID: 22496226 Free PMC article.
-
NF-κB directly mediates epigenetic deregulation of common microRNAs in Epstein-Barr virus-mediated transformation of B-cells and in lymphomas.Nucleic Acids Res. 2014;42(17):11025-39. doi: 10.1093/nar/gku826. Epub 2014 Sep 8. Nucleic Acids Res. 2014. PMID: 25200074 Free PMC article.
-
Next-generation sequencing of miRNAs in clinical samples of Epstein-Barr virus-associated B-cell lymphomas.Cancer Med. 2017 Mar;6(3):605-618. doi: 10.1002/cam4.1006. Epub 2017 Feb 9. Cancer Med. 2017. PMID: 28181423 Free PMC article.
-
Mechanisms of B-Cell Oncogenesis Induced by Epstein-Barr Virus.J Virol. 2019 Jun 14;93(13):e00238-19. doi: 10.1128/JVI.00238-19. Print 2019 Jul 1. J Virol. 2019. PMID: 30971472 Free PMC article. Review.
-
Steps involved in immortalization and tumorigenesis in human B-lymphoblastoid cell lines transformed by Epstein-Barr virus.Cancer Res. 2004 May 15;64(10):3361-4. doi: 10.1158/0008-5472.CAN-04-0079. Cancer Res. 2004. PMID: 15150084 Review.
Cited by
-
Inflammatory response of macrophages cultured with Helicobacter pylori strains was regulated by miR-155.Int J Clin Exp Pathol. 2015 May 1;8(5):4545-54. eCollection 2015. Int J Clin Exp Pathol. 2015. PMID: 26191144 Free PMC article.
-
Viral non-coding RNAs: Stealth strategies in the tug-of-war between humans and herpesviruses.Semin Cell Dev Biol. 2021 Mar;111:135-147. doi: 10.1016/j.semcdb.2020.06.015. Epub 2020 Jul 3. Semin Cell Dev Biol. 2021. PMID: 32631785 Free PMC article. Review.
-
Both MicroRNA-155 and Virus-Encoded MiR-155 Ortholog Regulate TLR3 Expression.PLoS One. 2015 May 4;10(5):e0126012. doi: 10.1371/journal.pone.0126012. eCollection 2015. PLoS One. 2015. PMID: 25938551 Free PMC article.
-
In-depth analysis of the interaction of HIV-1 with cellular microRNA biogenesis and effector mechanisms.mBio. 2013 Apr 16;4(2):e000193. doi: 10.1128/mBio.00193-13. mBio. 2013. PMID: 23592263 Free PMC article.
-
Transcriptomics and miRNomics data integration in lymphoblastoid cells highlights the key role of immune-related functions in lithium treatment response in Bipolar disorder.BMC Psychiatry. 2022 Oct 27;22(1):665. doi: 10.1186/s12888-022-04286-3. BMC Psychiatry. 2022. PMID: 36303132 Free PMC article.
References
-
- Asangani, I. A., S. A. Rasheed, D. A. Nikolova, J. H. Leupold, N. H. Colburn, S. Post, and H. Allgayer. 2008. MicroRNA-21 (miR-21) post-transcriptionally downregulates tumor suppressor Pdcd4 and stimulates invasion, intravasation and metastasis in colorectal cancer. Oncogene 27:2128-2136. - PubMed
-
- Bartel, D. P. 2004. MicroRNAs: genomics, biogenesis, mechanism, and function. Cell 116:281-297. - PubMed
-
- Bell, A. I., K. Groves, G. L. Kelly, D. Croom-Carter, E. Hui, A. T. Chan, and A. B. Rickinson. 2006. Analysis of Epstein-Barr virus latent gene expression in endemic Burkitt's lymphoma and nasopharyngeal carcinoma tumour cells by using quantitative real-time PCR assays. J. Gen. Virol. 87:2885-2890. - PubMed
Publication types
MeSH terms
Substances
Grants and funding
LinkOut - more resources
Full Text Sources
Other Literature Sources

